Menu
Important: This documentation is about an older version. It's relevant only to the release noted, many of the features and functions have been updated or replaced. Please view the current version.
Enterprise
Open source
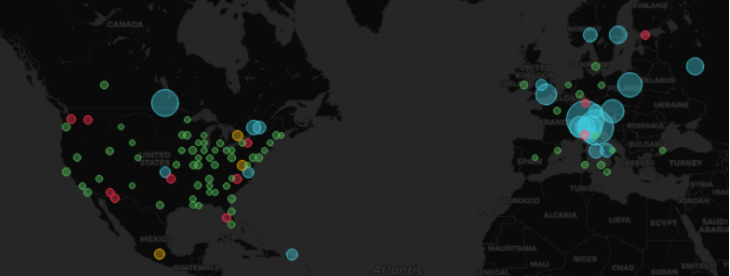
Markers layer
The markers layer allows you to display data points as different marker shapes such as circles, squares, triangles, stars, and more.
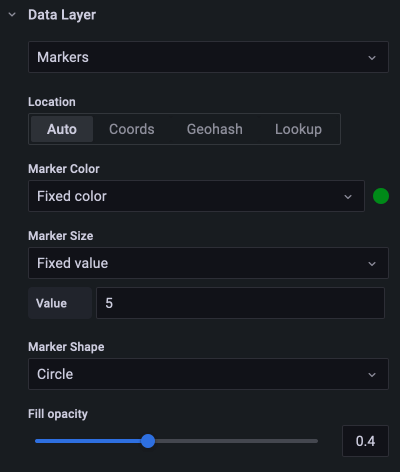
- Marker Color configures the color of the marker. The default
Single colorkeeps all points a single color. There is an alternate option to have multiple colors depending on the data point values and the threshold set at theThresholdssection. - Marker Size configures the size of the marker. The default is
Fixed size, which makes all marker sizes the same regardless of the data points. However, there is also an option to scale the circles to the corresponding data points.MinandMaxmarker size has to be set such that the Marker layer can scale within this range. - Marker Shape allows you to choose the shape, icon, or graphic to aid in providing additional visual context to your data. Choose from assets that are included with Grafana such as simple shapes or the Unicon library. You can also specify a URL containing an image asset. The image must be a scalable vector graphic (SVG).
- Fill opacity configures the transparency of each marker.


