
Menu
Important: This documentation is about an older version. It's relevant only to the release noted, many of the features and functions have been updated or replaced. Please view the current version.
Enterprise
Open source
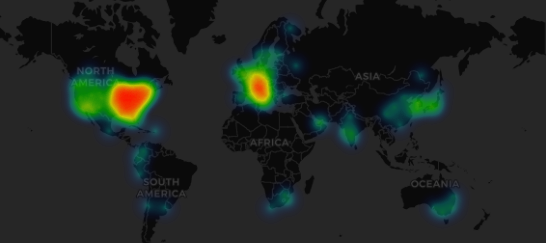
Heatmap layer
The heatmap layer clusters various data points to visualize locations with different densities. To add a heatmap layer:
Click on the drop-down menu under Data Layer and choose Heatmap.
Similar to Markers, you are prompted with various options to determine which data points to visualize and how you want to visualize them.
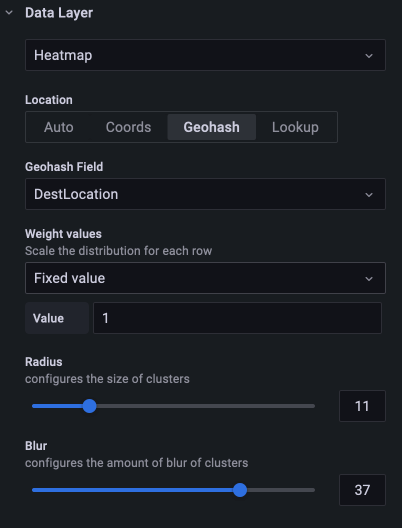
- Weight values configure the intensity of the heatmap clusters.
Fixed valuekeeps a constant weight value throughout all data points. This value should be in the range of 0~1. Similar to Markers, there is an alternate option in the drop-down to automatically scale the weight values depending on data values. - Radius configures the size of the heatmap clusters.
- Blur configures the amount of blur on each cluster.
Was this page helpful?
Related resources from Grafana Labs

Getting started with the Grafana LGTM Stack
In this webinar, we’ll demo how to get started using the LGTM Stack: Loki for logs, Grafana for visualization, Tempo for traces, and Mimir for metrics.

Getting started with Grafana dashboard design
In this webinar, you'll learn how to design stylish and easily accessible Grafana dashboards that tell a story.

Building advanced Grafana dashboards
In this webinar, we’ll demo how to build and format Grafana dashboards.