Important: This documentation is about an older version. It's relevant only to the release noted, many of the features and functions have been updated or replaced. Please view the current version.
Use dashboards
Note: Looking for prebuilt Grafana dashboards? Check out our full library of dashboards and more →
This topic provides an overview of dashboard features and shortcuts, and describes how to use dashboard search.
Dashboard feature overview
The dashboard user interface provides a number of features that you can use to customize the presentation of your data.
The following image and descriptions highlights all dashboards features.
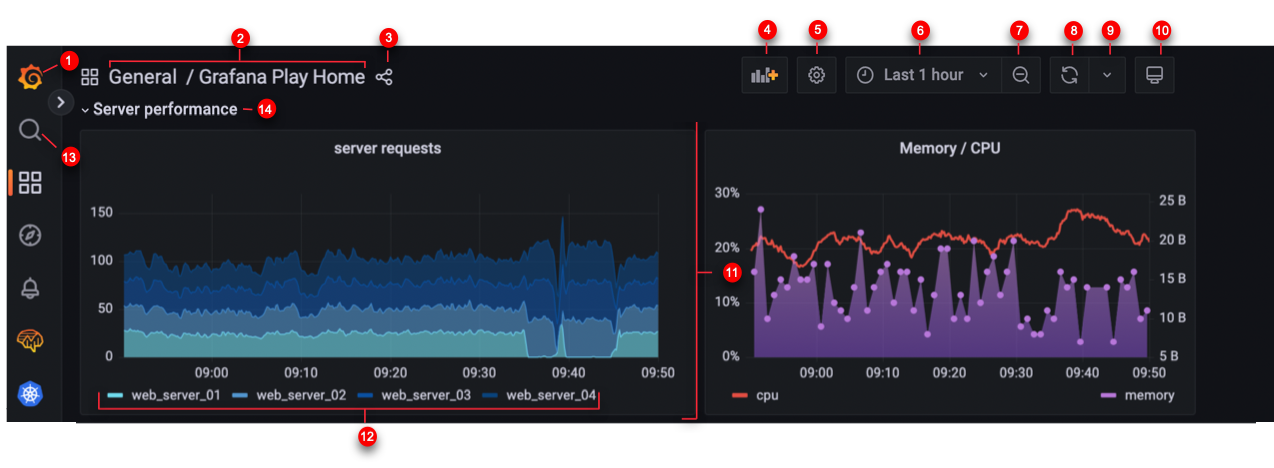
- Grafana home (1): Click the Grafana home icon to be redirected to the home page configured in the Grafana instance.
- Dashboard title (2): When you click the dashboard title you can search for dashboard contained in the current folder.
- Share dashboard (3): Use this option to share the current dashboard by link or snapshot. You can also export the dashboard definition from the share modal.
- Add panel (4): Use this option to add a panel, dashboard row, or library panel to the current dashboard.
- Dashboard settings (5): Use this option to change dashboard name, folder, and tags and manage variables and annotation queries.
- Time picker dropdown (6): Click to select relative time range options and set custom absolute time ranges.
- Zoom out time range (7): Click to zoom out the time range. For more information about how to use time range controls, refer to Common time range controls.
- Refresh dashboard (8): Click to immediately trigger queries and refresh dashboard data.
- Refresh dashboard time interval (9): Click to select a dashboard auto refresh time interval.
- View mode (10): Click to display the dashboard on a large screen such as a TV or a kiosk. View mode hides irrelevant information such as navigation menus. For more information about view mode, refer to How to Create Kiosks to Display Dashboards on a TV.
- Dashboard panel (11): The primary building block of a dashboard is the panel. To add a new panel, dashboard row, or library panel, click Add panel.
- Library panels can be shared among many dashboards.
- To move a panel, drag the panel header to another location.
- To resize a panel, click and drag the lower right corner of the panel.
- Graph legend (12): Change series colors, y-axis and series visibility directly from the legend.
- Search (13): Click Search to search for dashboards by name or panel title.
- Dashboard row (14): A dashboard row is a logical divider within a dashboard that groups panels together.
- Rows can be collapsed or expanded allowing you to hide parts of the dashboard.
- Panels inside a collapsed row do not issue queries.
- Use the repeating rows to dynamically create rows based on a template variable.
Keyboard shortcuts
Grafana has a number of keyboard shortcuts available. Press ? or h on your keyboard to display all keyboard shortcuts available in your version of Grafana.
Ctrl+S: Saves the current dashboard.f: Opens the dashboard finder / search.d+k: Toggle kiosk mode (hides the menu).d+e: Expand all rows.d+s: Dashboard settings.Ctrl+K: Opens the command palette.Esc: Exits panel when in fullscreen view or edit mode. Also returns you to the dashboard from dashboard settings.
Focused panel
By hovering over a panel with the mouse you can use some shortcuts that will target that panel.
e: Toggle panel edit viewv: Toggle panel fullscreen viewps: Open Panel Share Modalpd: Duplicate Panelpr: Remove Panelpl: Toggle panel legend
Dashboard search
You can search for dashboards by dashboard name and by panel title. When you search for dashboards, the system returns all dashboards available within the Grafana instance, even if you do not have permission to view the contents of the dashboard.
Search dashboards using dashboard name
Begin typing any part of the dashboard name in the search bar. The search returns results for any partial string match in real-time, as you type.
Dashboard search is:
- Real-time
- Not case sensitive
- Functional across stored and file based dashboards.
**Note: You can use your keyboard arrow keys to navigate the results and press
Enterto open the selected dashboard.
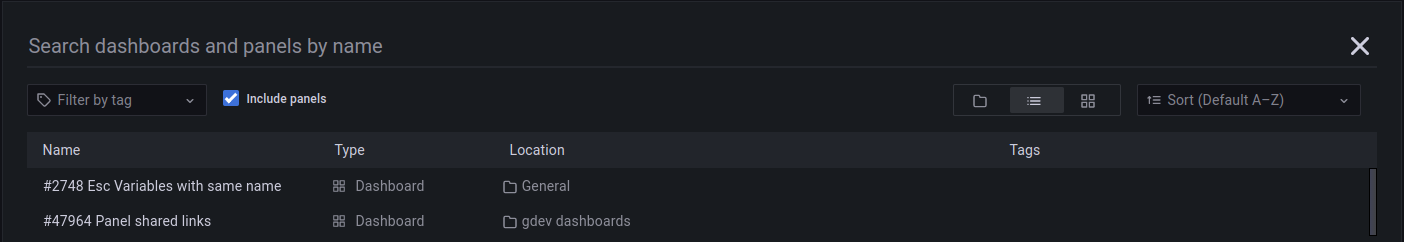
The following image shows the search results when you search using dashboard name.

Search dashboards using panel title
You can search for a dashboard by the title of a panel that appears in a dashboard. If a panel’s title matches your search query, the dashboard appears in the search results.
This feature is available by default in Grafana Cloud and in Grafana OSS v9.1 and higher, you access this feature by enabling the panelTitleSearch feature toggle.
For more information about enabling panel title search, refer to Enable the panelTitleSearch feature toggle.
The following image shows the search results when you search using panel title.
Enable the panelTitleSearch feature toggle
Complete the following steps to enable the panelTitleSearch feature toggle.
Before you begin:
- If you are running Grafana Enterprise with RBAC, enable service accounts.
To enable the panelTitleSearch feature toggle:
Open the Grafana configuration file.
Locate the feature_toggles section.
Add the following parameter to the
feature_togglessection:[feature_toggles] # enable features, separated by spaces enable = dashboardPreviewsSave your changes and restart the Grafana server.
Filter dashboard search results by tag(s)
Tags are a great way to organize your dashboards, especially as the number of dashboards grow. You can add and manage tags in dashboard Settings.
When you select multiple tags, Grafana shows dashboards that include all selected tags.
To filter dashboard search result by a tag, complete one of the following steps:
To filter dashboard search results by tag, click a tag that appears in the right column of the search results.
You can continue filtering by clicking additional tags.
To see a list of all available tags, click the Filter by tags dropdown menu and select a tag.
All tags will be shown, and when you select a tag, the dashboard search will be instantly filtered.
Note: When using only a keyboard, press the
tabkey and navigate to the Filter by tag drop-down menu, press the down arrow key▼to activate the menu and locate a tag, and pressEnterto select the tag.


