
Important: This documentation is about an older version. It's relevant only to the release noted, many of the features and functions have been updated or replaced. Please view the current version.
Reference: Query options
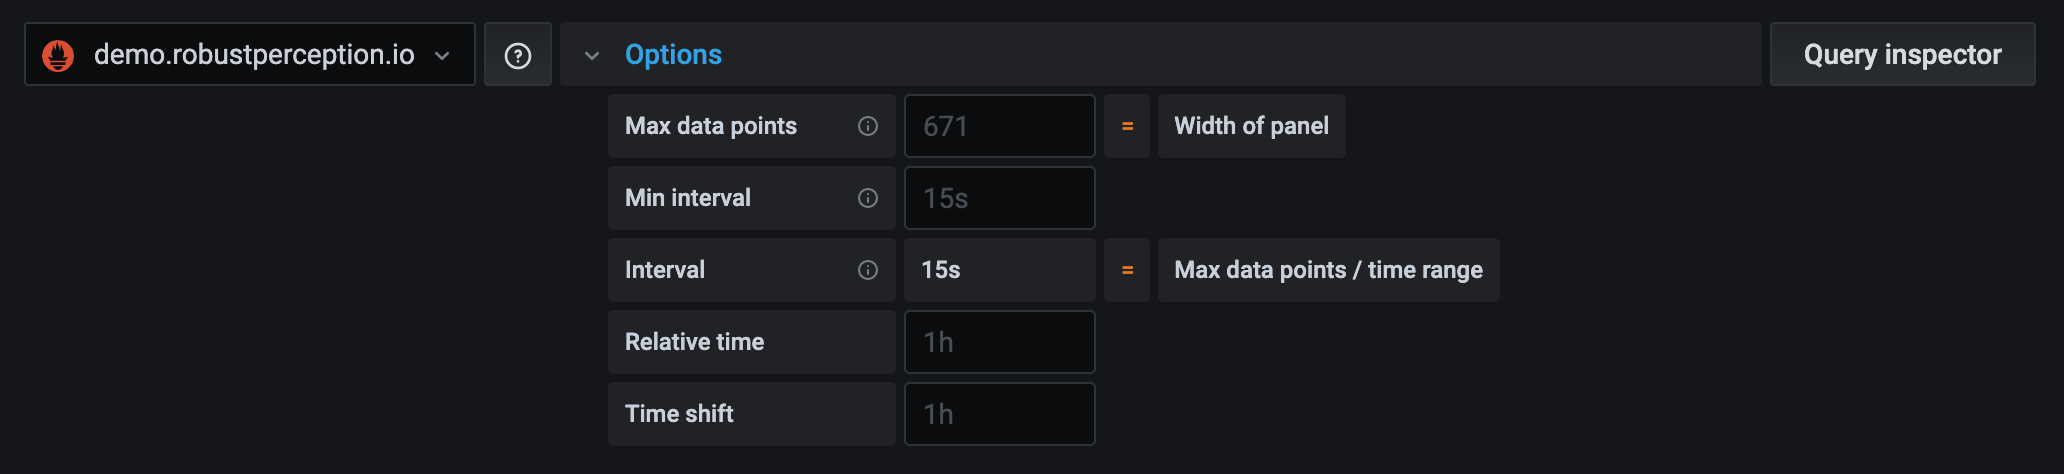
Click Query options next to the data source selector to see settings for your selected data source. Changes you make here affect only queries made in this panel.
Grafana sets defaults that are shown in dark gray text. Changes are displayed in white text. To return a field to the default setting, delete the white text from the field.
Panel data source query options:
Max data points - If the data source supports it, sets the maximum numbers of data points for each series returned. If the query returns more data points than the max data points setting, then the data source consolidates them (reduces the number of points returned by aggregating them together by average or max or other function).
There are two main reasons for limiting the number of points, performance and smoothing the line. The default value is the width (or number of pixels) of the graph as there is no point in having more data points than the graph panel can display.
With streaming data, the max data points value is used for the rolling buffer. (Streaming is a continuous flow of data and buffering is a way of dividing the stream into chunks). Loki streams data in the live tailing mode.
Min interval - Sets a minimum limit for the automatically calculated interval, typically the minimum scrape interval. If a data point is saved every 15 seconds, then there’s no point in having an interval lower than that. Another use case is to set it to a higher minimum than the scrape interval to get more coarse-grained, well-functioning queries.
Interval - The interval is a time span that you can use when aggregating or grouping data points by time.
Grafana automatically calculates an appropriate interval and it can be used as a variable in templated queries. The variable is either in seconds:
$__intervalor in milliseconds:$__interval_ms. It is typically used in aggregation functions like sum or average. For example, a Prometheus query using the interval variable:rate(http_requests_total[$__interval]).This automatic interval is calculated based on the width of the graph. If the user zooms out a lot then the interval becomes greater, resulting in a more coarse grained aggregation whereas if the user zooms in then the interval decreases resulting in a more fine grained aggregation.
For more information, refer to Global variables.
Relative time - You can override the relative time range for individual panels, causing them to be different than what is selected in the dashboard time picker in the top right corner of the dashboard. This allows you to show metrics from different time periods or days on the same dashboard.
Time shift - The time shift function is another way to override the time range for individual panels. It only works with relative time ranges and allows you to adjust the time range.
For example, you could shift the time range for the panel to be two hours earlier than the dashboard time picker. For more information, refer to Time range controls.
Cache timeout - (This field is only visible if available in your data source.) If your time series store has a query cache, then this option can override the default cache timeout. Specified as a numeric value in seconds.
Examples:
- Relative time:
| Example | Relative time field |
|---|---|
| Last 5 minutes | now-5m |
| The day so far | now/d |
| Last 5 days | now-5d/d |
| This week so far | now/w |
| Last 2 years | now-2y/y |
- Time shift:
| Example | Time shift field |
|---|---|
| Last entire week | 1w/w |
| Two entire weeks ago | 2w/w |
| Last entire month | 1M/M |
| This entire year | 1d/y |
| Last entire year | 1y/y |
Was this page helpful?
Related resources from Grafana Labs


