Important: This documentation is about an older version. It's relevant only to the release noted, many of the features and functions have been updated or replaced. Please view the current version.
Tempo data source
Grafana ships with built-in support for Tempo a high volume, minimal dependency trace storage, OSS tracing solution from Grafana Labs. Add it as a data source, and you are ready to query your traces in Explore.
Add data source
To access Tempo settings, click the Configuration (gear) icon, then click Data Sources > Tempo.
| Name | Description |
|---|---|
Name | The name using which you will refer to the data source in panels, queries, and Explore. |
Default | The default data source will be pre-selected for new panels. |
URL | The URL of the Tempo instance, e.g., http://tempo |
Basic Auth | Enable basic authentication to the Tempo data source. |
User | User name for basic authentication. |
Password | Password for basic authentication. |
Trace to logs
Note: This feature is available in Grafana 7.4+.
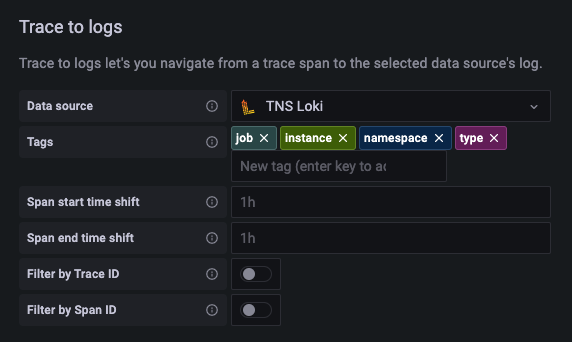
This is a configuration for the trace to logs feature. Select target data source (at this moment limited to Loki or Splunk [logs] data sources) and select which tags will be used in the logs query.
- Data source - Target data source.
- Tags - The tags that will be used in the logs query. Default is
'cluster', 'hostname', 'namespace', 'pod'. - Map tag names - When enabled, allows configuring how Tempo tag names map to logs label names. For example, map
service.nametoservice. - Span start time shift - A shift in the start time for the logs query based on the start time for the span. To extend the time to the past, use a negative value. You can use time units, for example, 5s, 1m, 3h. The default is 0.
- Span end time shift - Shift in the end time for the logs query based on the span end time. Time units can be used here, for example, 5s, 1m, 3h. The default is 0.
- Filter by Trace ID - Toggle to append the trace ID to the logs query.
- Filter by Span ID - Toggle to append the span ID to the logs query.
Trace to metrics
Note: This feature is behind the
traceToMetricsfeature toggle.
To configure trace to metrics, select the target Prometheus data source and create any desired linked queries.
– Data source - Target data source.
Each linked query consists of:
– Link Label - (Optional) Descriptive label for the linked query. – Query - Query that runs when navigating from a trace to the metrics data source.
Service Graph
This is a configuration for the Service Graph feature.
– Data source - Prometheus instance where the Service Graph data is stored.
Search
This is a configuration for Tempo search.
– Hide search - Optionally, hide the search query option in Explore in cases where search is not configured in the Tempo instance.
Node Graph
This is a configuration for the beta Node Graph visualization. The Node Graph is shown after the trace view is loaded and is disabled by default.
– Enable Node Graph - Enables the Node Graph visualization.
Loki Search
This is a configuration for the Loki search query type.
– Data source - The Loki instance in which you want to search traces. You must configure derived fields in the Loki instance.
Query traces
You can query and display traces from Tempo via Explore.
Tempo search
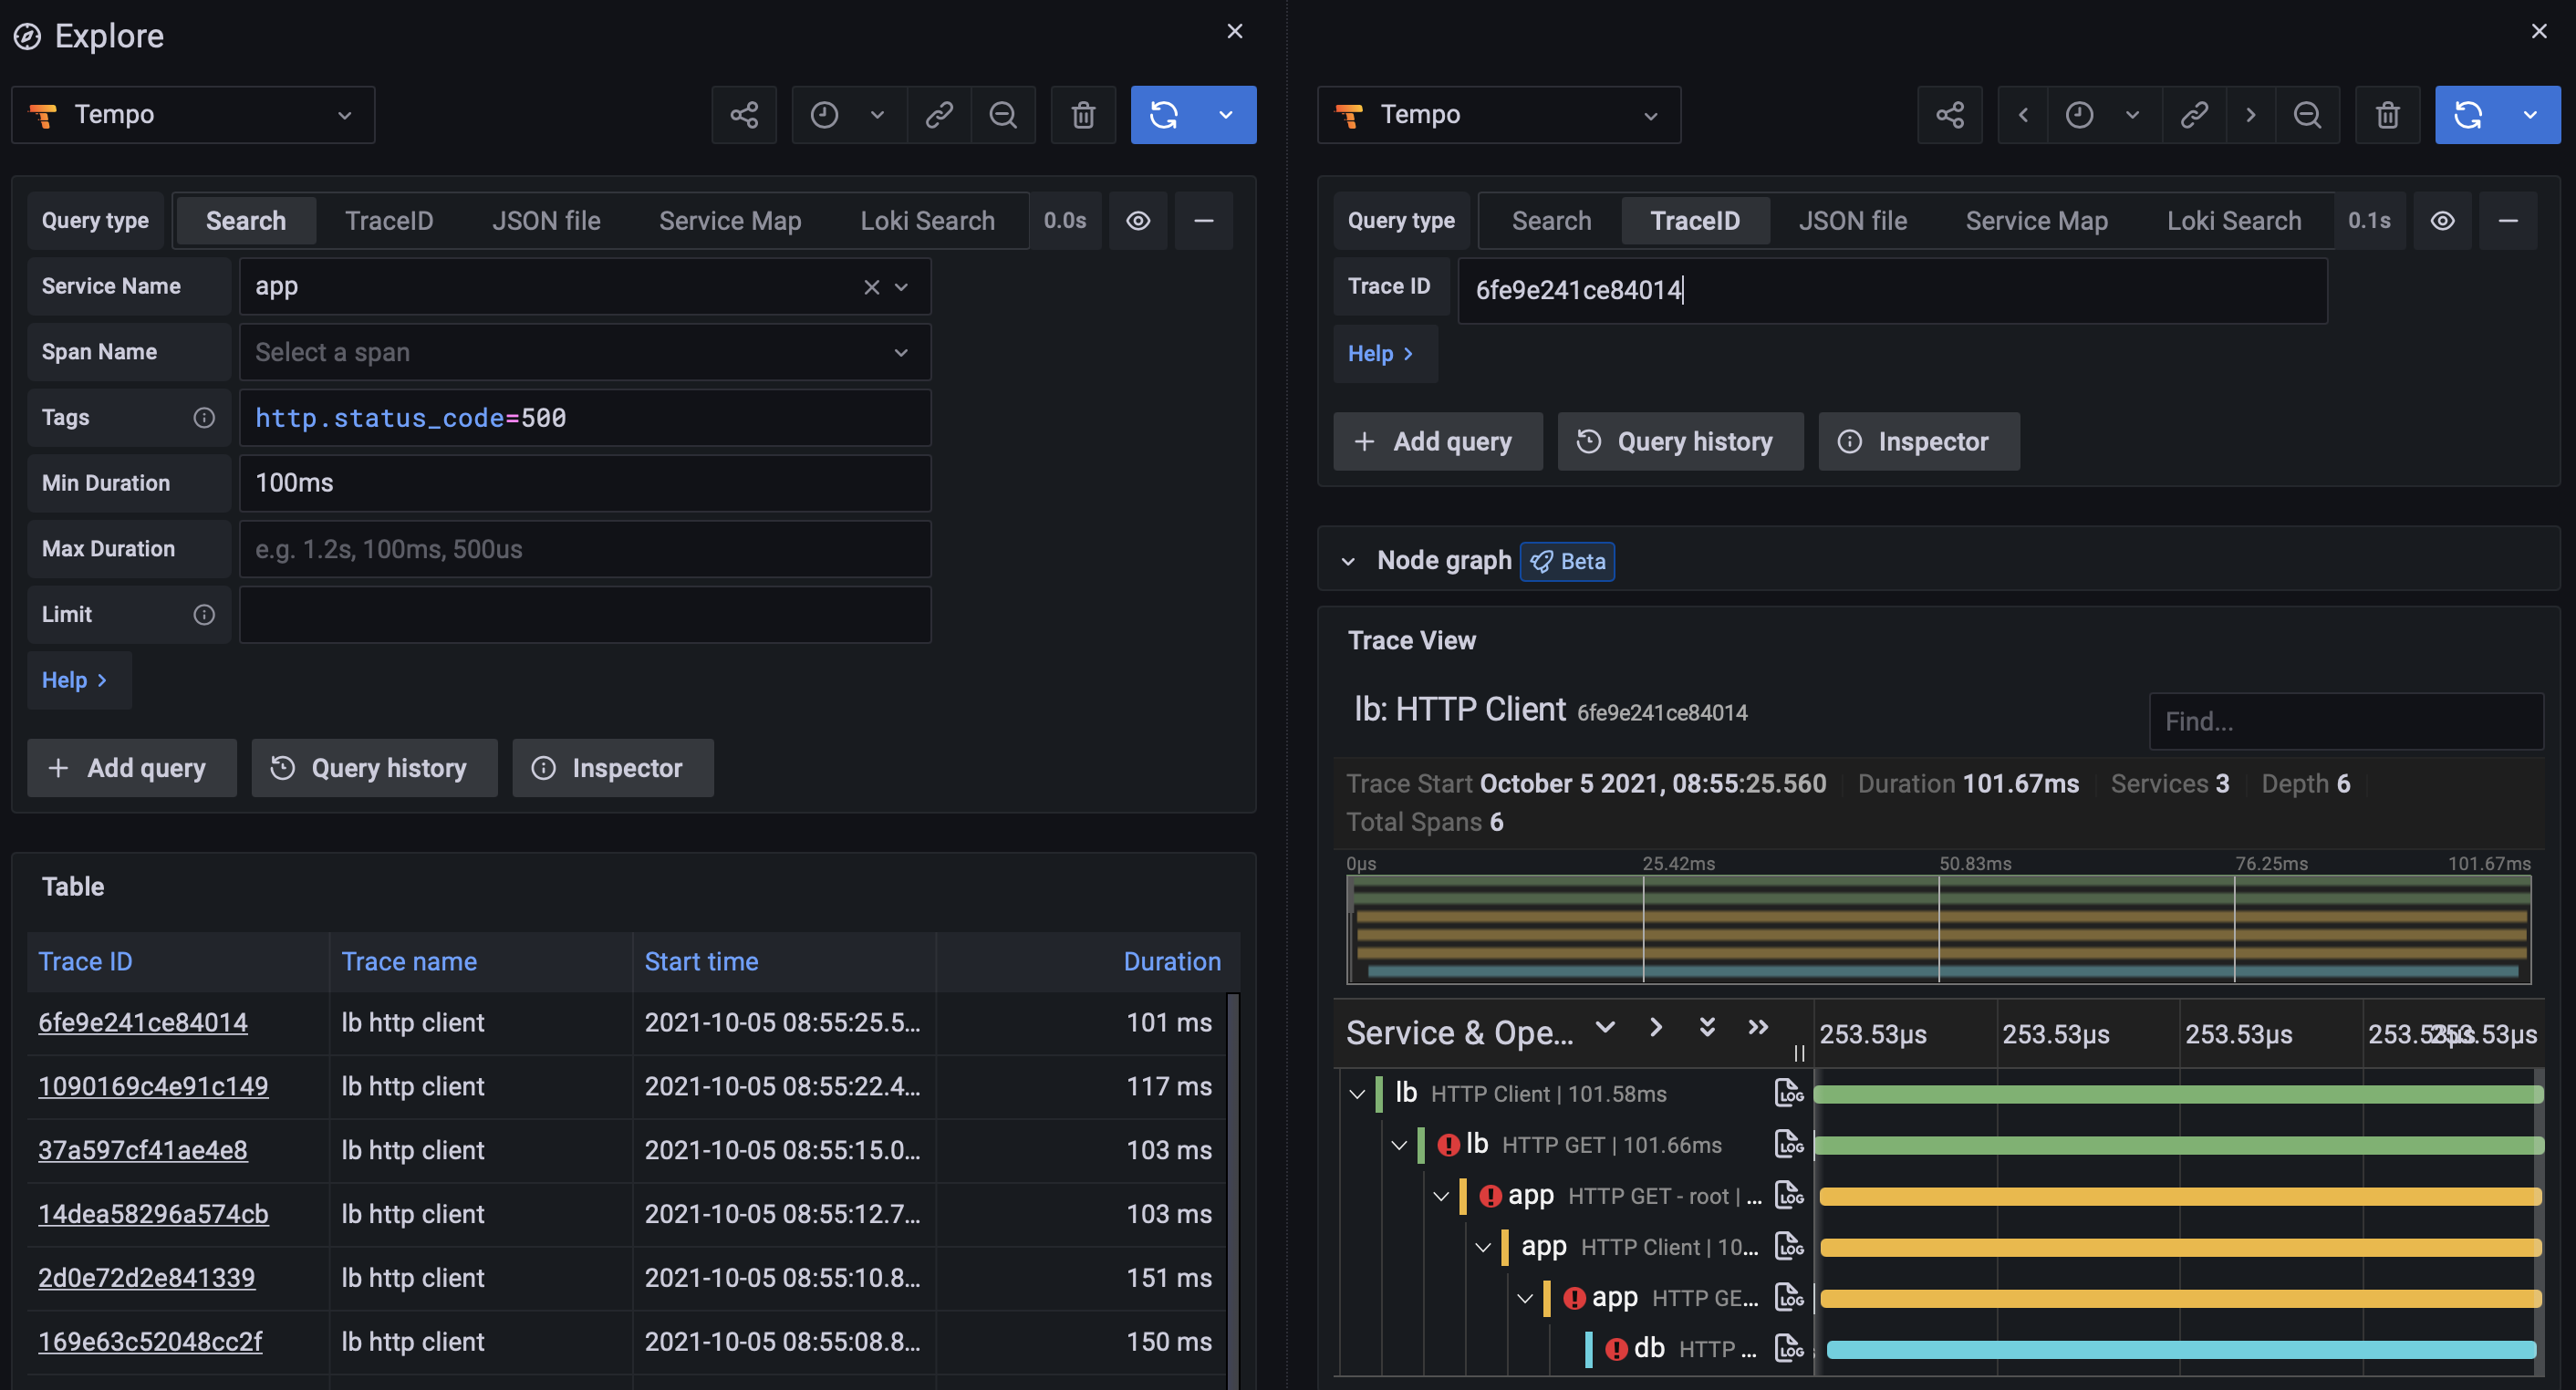
Tempo search is an experimental feature behind a feature toggle. Use this to search for traces by service name, span name, duration range, or process-level attributes that are included in your application’s instrumentation, such as HTTP status code and customer ID.
Search recent traces
Tempo allows you to search recent traces held in the ingesters. By default, ingesters store the last 15 minutes of tracing data, and this search is disabled. Enable this search capability by setting the tempoSearch feature toggle.
You must also configure your Tempo data source to use this feature. Refer to the Tempo documentation.
Search backend datastore
Tempo includes the ability to search the entire backend datastore. You can enable this capability by setting the tempoSearch and tempoBackendSearch feature toggles.
You must also configure your Tempo data source to use this feature.Refer to the Tempo documentation.
Loki search
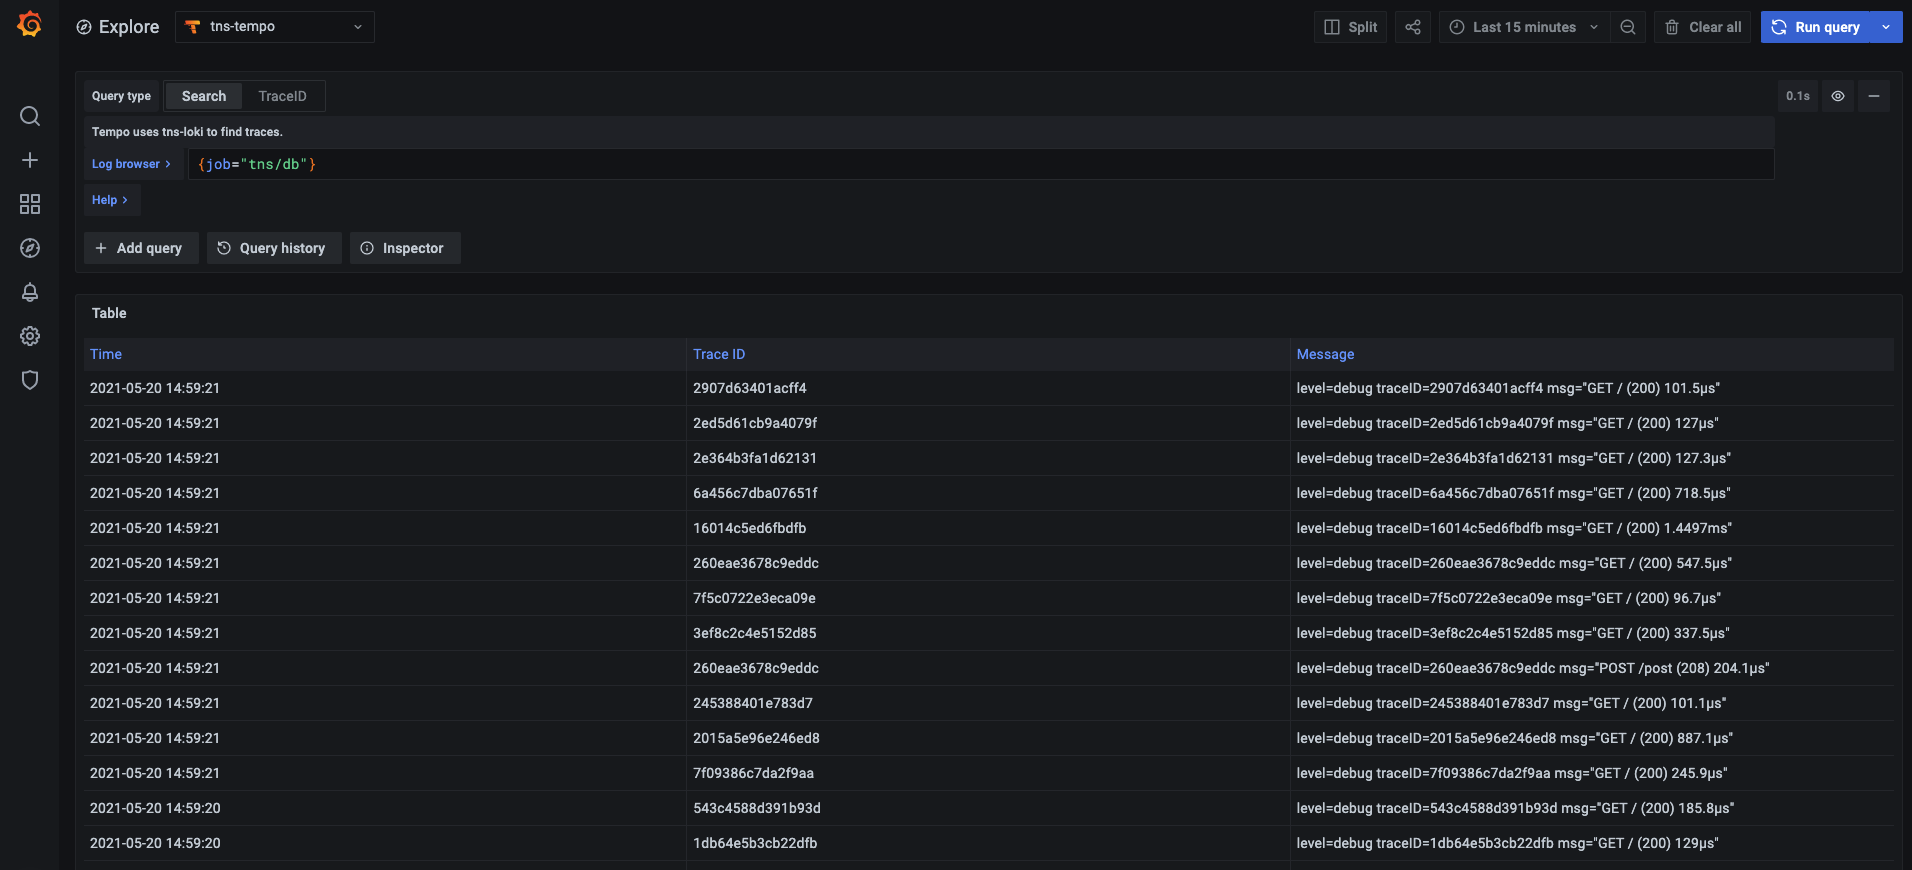
To find traces to visualize, use the Loki query editor. To get search results, you must have derived fields configured, which point to this data source.
Trace ID search
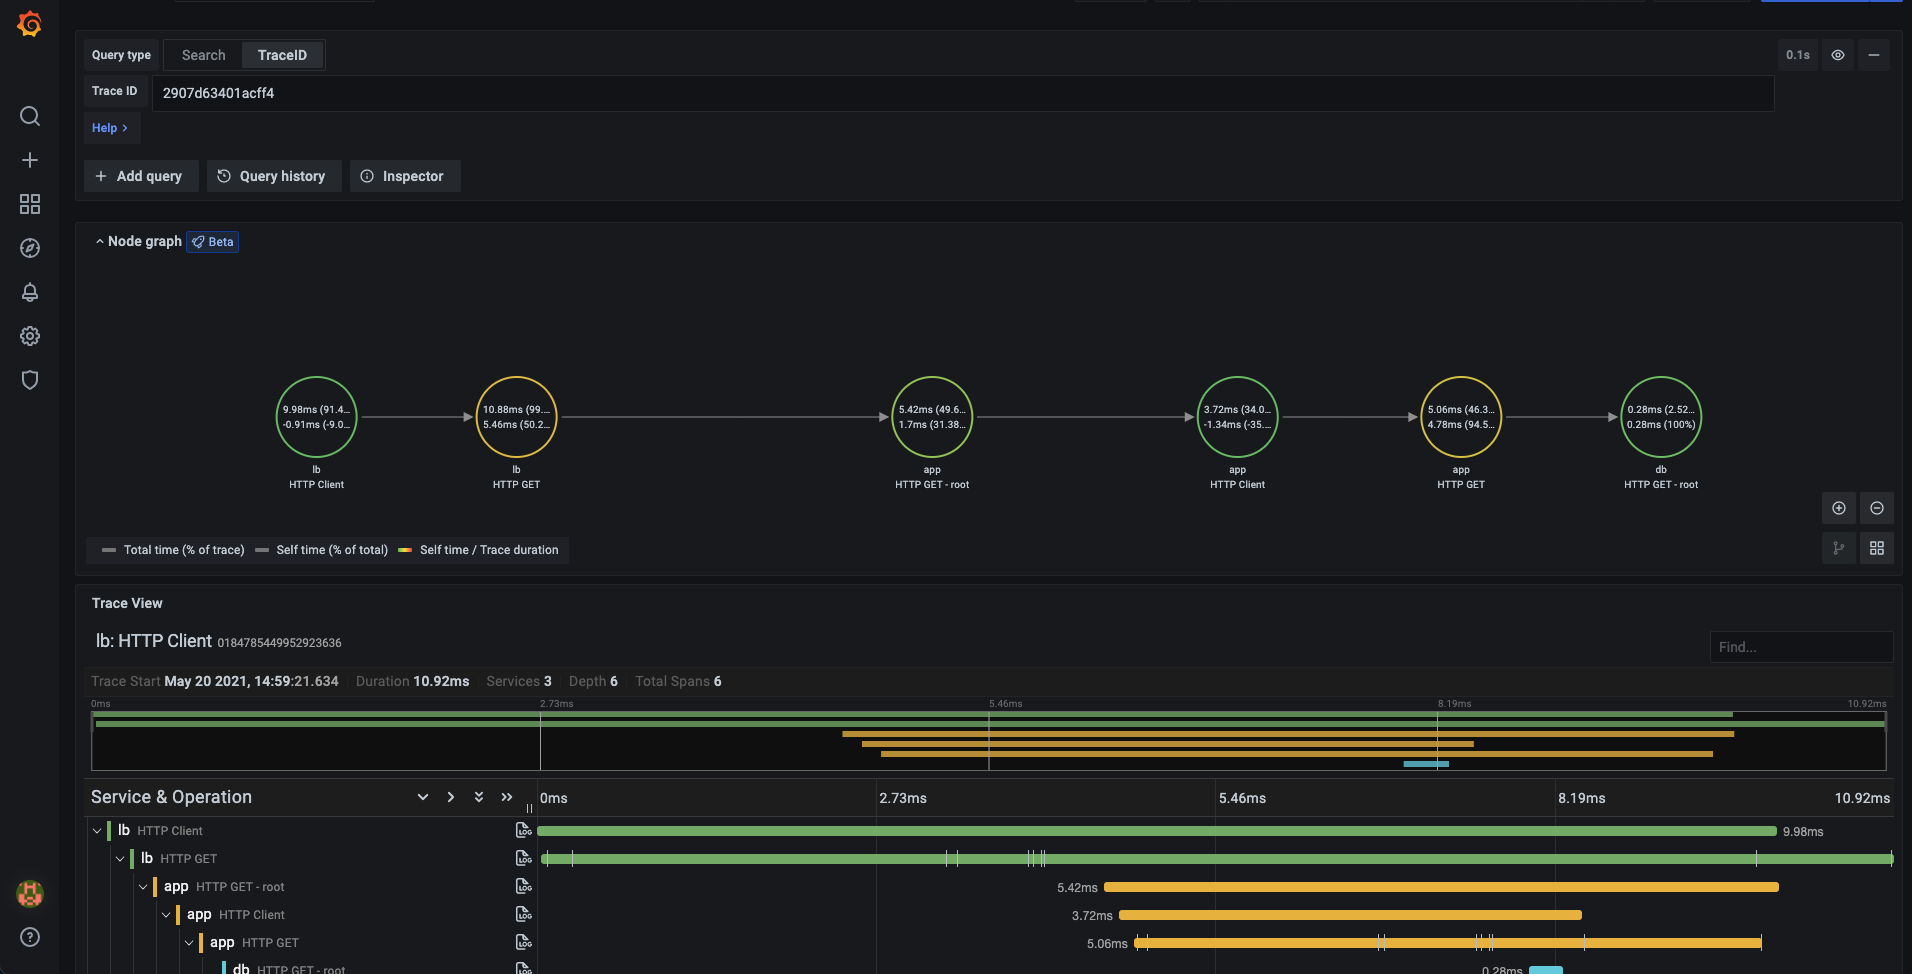
To query a particular trace, select the TraceID query type, and then put the ID into the Trace ID field.
Upload JSON trace file
You can upload a JSON file that contains a single trace to visualize it. If the file has multiple traces then the first trace is used for visualization.
Here is an example JSON:
{
  "batches": [
    {
      "resource": {
        "attributes": [
          { "key": "service.name", "value": { "stringValue": "db" } },
          { "key": "job", "value": { "stringValue": "tns/db" } },
          { "key": "opencensus.exporterversion", "value": { "stringValue": "Jaeger-Go-2.22.1" } },
          { "key": "host.name", "value": { "stringValue": "63d16772b4a2" } },
          { "key": "ip", "value": { "stringValue": "0.0.0.0" } },
          { "key": "client-uuid", "value": { "stringValue": "39fb01637a579639" } }
        ]
      },
      "instrumentationLibrarySpans": [
        {
          "instrumentationLibrary": {},
          "spans": [
            {
              "traceId": "AAAAAAAAAABguiq7RPE+rg==",
              "spanId": "cmteMBAvwNA=",
              "parentSpanId": "OY8PIaPbma4=",
              "name": "HTTP GET - root",
              "kind": "SPAN_KIND_SERVER",
              "startTimeUnixNano": "1627471657255809000",
              "endTimeUnixNano": "1627471657256268000",
              "attributes": [
                { "key": "http.status_code", "value": { "intValue": "200" } },
                { "key": "http.method", "value": { "stringValue": "GET" } },
                { "key": "http.url", "value": { "stringValue": "/" } },
                { "key": "component", "value": { "stringValue": "net/http" } }
              ],
              "status": {}
            }
          ]
        }
      ]
    }
  ]
}
Service Graph
A service graph is a visual representation of the relationships between services. Each node on the graph represents a service such as an API or database. With this graph, customers can easily detect performance issues, increases in error, fault, or throttle rates in any of their services, and dive deep into corresponding traces and root causes.
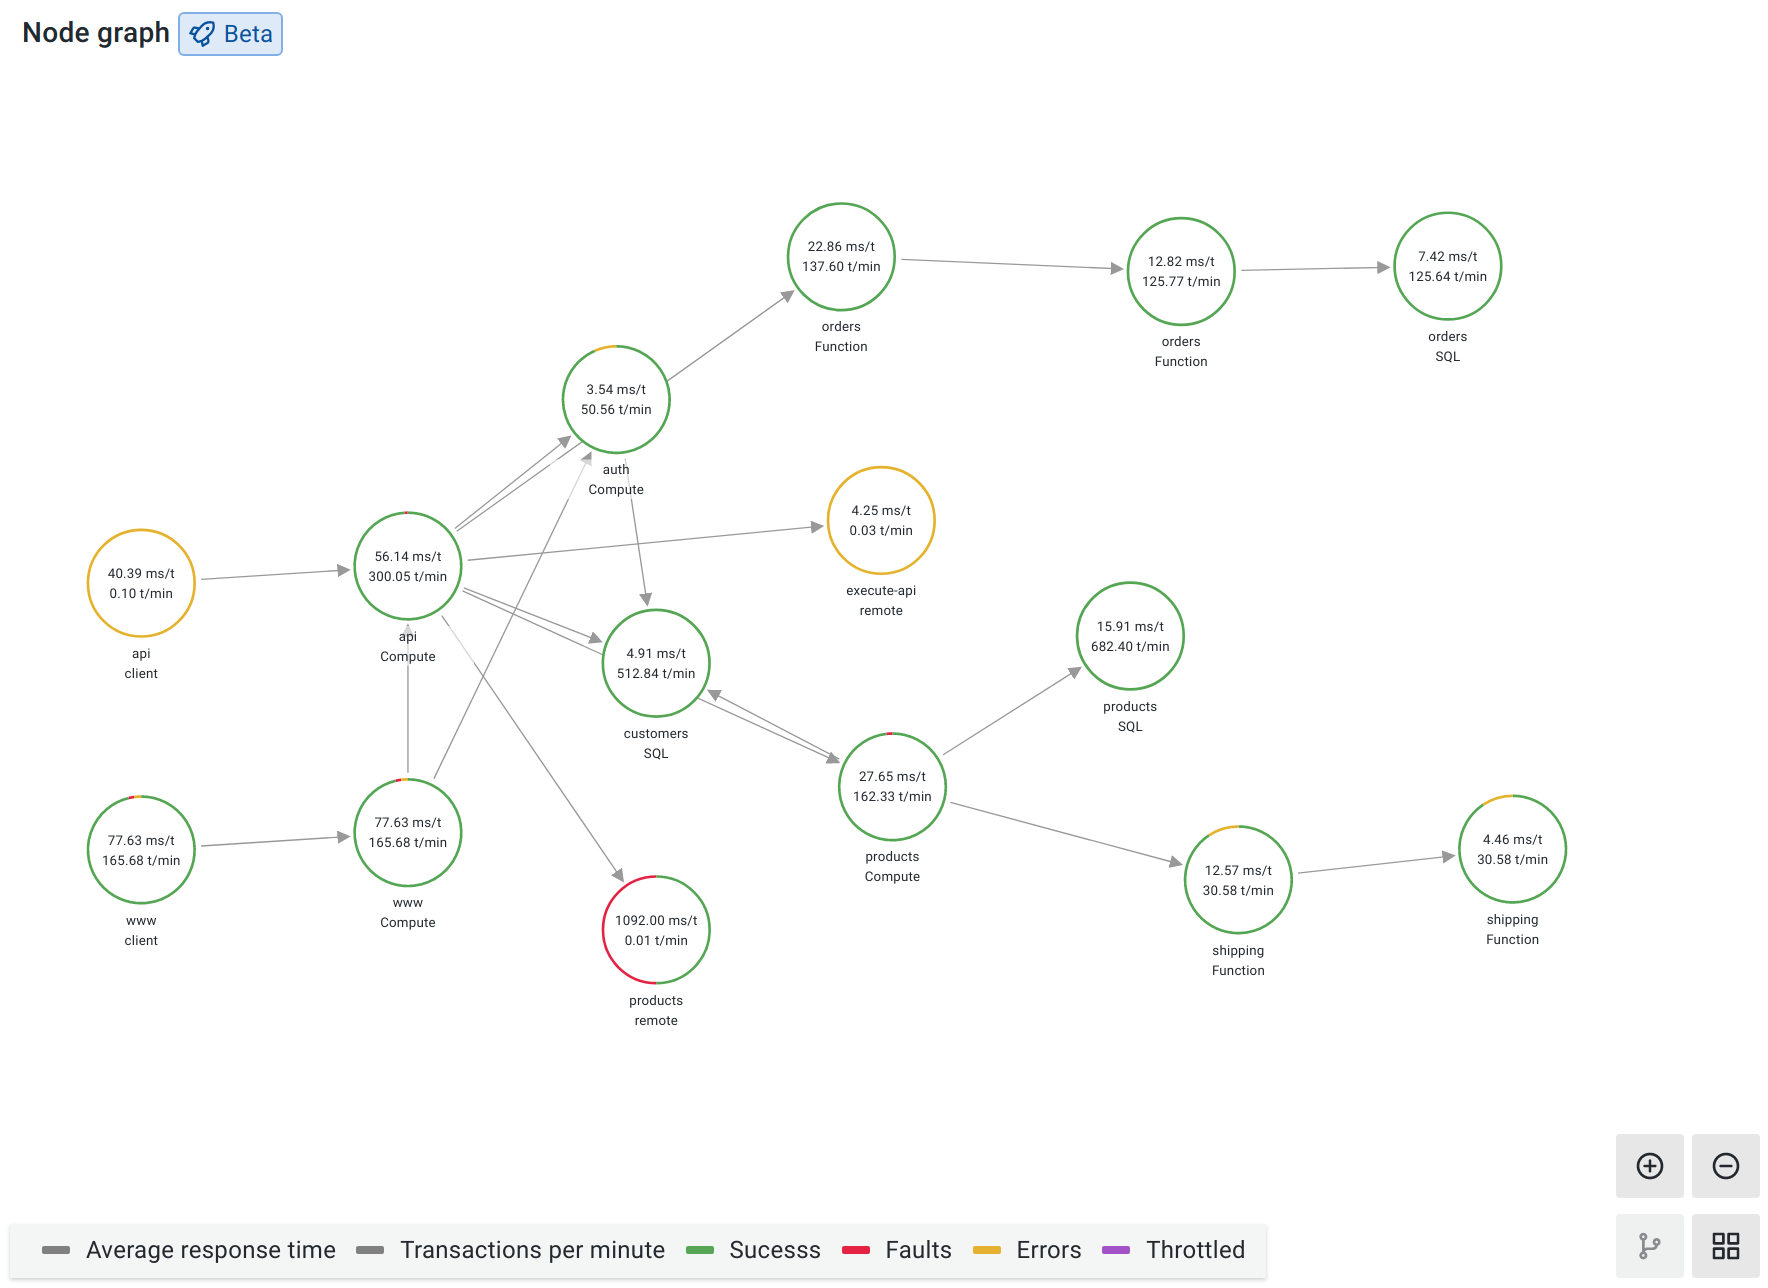
To display the service graph:
- Configure the Grafana Agent to generate service graph data
- Link a Prometheus datasource in the Tempo datasource settings.
- Navigate to Explore
- Select the Tempo datasource
- Select the Service Graph query type and run the query
- Optionally, filter by service name
You can pan and zoom the view with buttons or you mouse. For details about the visualization, refer to Node graph panel.
Each service in the graph is represented as a circle. Numbers on the inside shows average time per request and request per second.
The color of each circle represents the percentage of requests in each of the following states:
- green = success
- red = fault
- yellow = errors
- purple = throttled responses
Click on the service to see a context menu with additional links for quick navigation to other relevant information.
Linking Trace ID from logs
You can link to Tempo trace from logs in Loki or Elastic by configuring an internal link. See the Derived fields section in the Loki data source or Data links section in the Elastic data source for configuration instructions.
Provision the Tempo data source
You can modify the Grafana configuration files to provision the Tempo data source. Read more about how it works and all the settings you can set for data sources on the provisioning topic.
Here is an example config:
apiVersion: 1

datasources:
  - name: Tempo
    type: tempo
    # Access mode - proxy (server in the UI) or direct (browser in the UI).
    access: proxy
    url: http://localhost:3200
    jsonData:
      httpMethod: GET
      tracesToLogs:
        datasourceUid: 'loki'
        tags: ['job', 'instance', 'pod', 'namespace']
        mappedTags: [{ key: 'service.name', value: 'service' }]
        mapTagNamesEnabled: false
        spanStartTimeShift: '1h'
        spanEndTimeShift: '1h'
        filterByTraceID: false
        filterBySpanID: false
      serviceMap:
        datasourceUid: 'prometheus'
      search:
        hide: false
      nodeGraph:
        enabled: true
      lokiSearch:
        datasourceUid: 'loki'


