Important: This documentation is about an older version. It's relevant only to the release noted, many of the features and functions have been updated or replaced. Please view the current version.
Prometheus data source
Grafana includes built-in support for Prometheus. This topic explains options, variables, querying, and other options specific to the Prometheus data source. Refer to Add a data source for instructions on how to add a data source to Grafana. Only users with the organization admin role can add data sources.
Note: You can use Grafana Cloud to avoid the overhead of installing, maintaining, and scaling your observability stack. The free forever plan includes Grafana, 10K Prometheus series, 50 GB logs, and more.Create a free account to get started.
Prometheus settings
To access Prometheus settings, hover your mouse over the Configuration (gear) icon, then click Data Sources, and then click the Prometheus data source.
| Name | Description |
|---|---|
Name | The data source name. This is how you refer to the data source in panels and queries. |
Default | Default data source that is pre-selected for new panels. |
Url | The URL of your Prometheus server, for example, http://prometheus.example.org:9090. |
Access | Server (default) = URL needs to be accessible from the Grafana backend/server, Browser = URL needs to be accessible from the browser. Note: Browser (direct) access is deprecated and will be removed in a future release. |
Basic Auth | Enable basic authentication to the Prometheus data source. |
User | User name for basic authentication. |
Password | Password for basic authentication. |
Scrape interval | Set this to the typical scrape and evaluation interval configured in Prometheus. Defaults to 15s. |
HTTP method | Use either POST or GET HTTP method to query your data source. POST is the recommended and pre-selected method as it allows bigger queries. Change this to GET if you have a Prometheus version older than 2.1 or if POST requests are restricted in your network. |
Disable metrics lookup | Checking this option will disable the metrics chooser and metric/label support in the query field’s autocomplete. This helps if you have performance issues with bigger Prometheus instances. |
Custom Query Parameters | Add custom parameters to the Prometheus query URL. For example timeout, partial_response, dedup, or max_source_resolution. Multiple parameters should be concatenated together with an ‘&’. |
| Exemplars configuration | |
Internal link | Enable this option is you have an internal link. When you enable this option, you will see a data source selector. Select the backend tracing data store for your exemplar data. |
Data source | You will see this option only if you enable Internal link option. Select the backend tracing data store for your exemplar data. |
URL | You will see this option only if the Internal link option is disabled. Enter the full URL of the external link. You can interpolate the value from the field with ${__value.raw } macro. |
URL Label | (Optional) add a custom display label to override the value of the Label name field. |
Label name | Add a name for the exemplar traceID property. |
Prometheus query editor
Prometheus query editor is separated into 3 distinct modes that you can switch between. See docs for each section below.

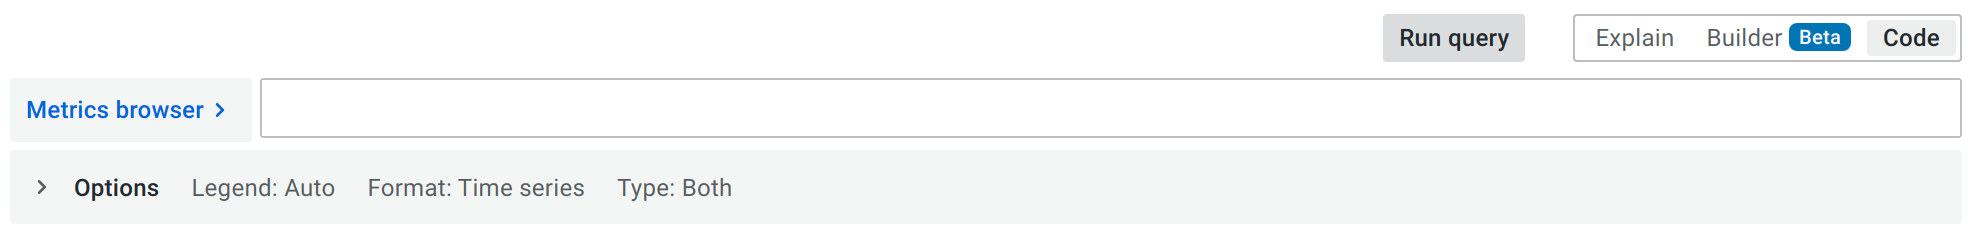
At the top of the editor, select Run queries to run a query. Select Explain | Builder | Code tabs to switch between the editor modes. If the query editor is in Builder mode, there are additional elements explained in the Builder section.
Note: In Explore, to run Prometheus queries, select
Run query.
Each mode is synchronized with the other modes, so you can switch between them without losing your work, although there are some limitations. Some more complex queries are not yet supported in the builder mode. If you try to switch from Code to Builder with such query, editor will show a popup explaining that you can lose some parts of the query, and you can decide if you still want to continue to Builder mode or not.
Code mode
Code mode allows you to write raw queries in a textual editor. It implements advanced autocomplete features and syntax highlighting to help with writing complex queries. In addition, it also contains Metrics browser to further aid with writing queries (see more docs below).
For more information about Prometheus query language, refer to the Prometheus documentation.
Autocomplete
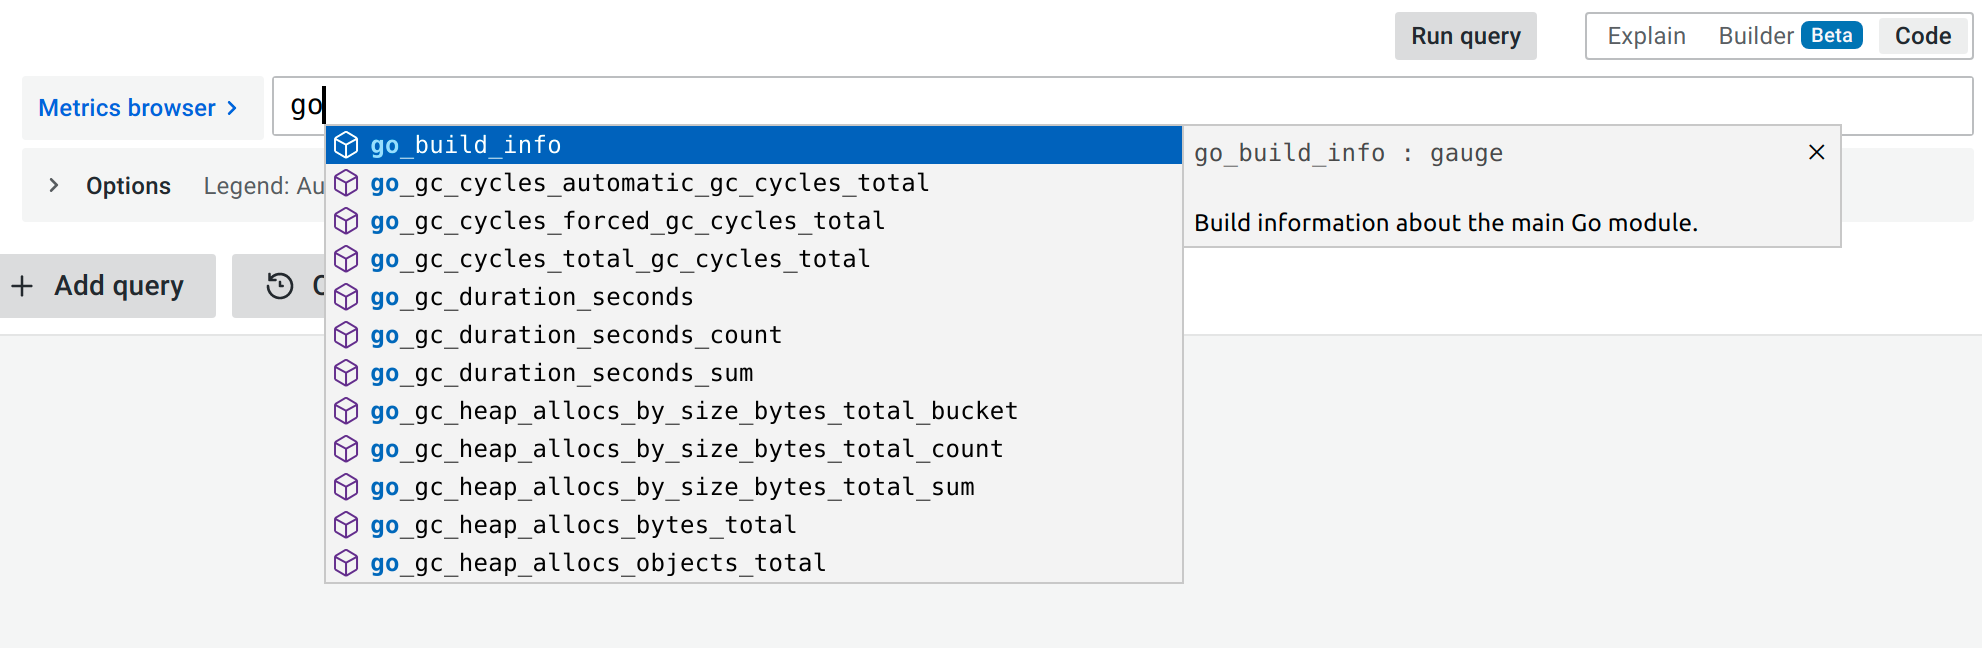
Autocomplete kicks automatically in appropriate times during typing. Use ctrl/cmd + space to trigger autocomplete manually when needed. Autocomplete can suggest both static functions, aggregations and keywords but also dynamic items like metrics and labels. Autocomplete dropdown also shows documentation for the suggested items, either static one or dynamic metric documentation where available.
In Explore use shift + enter to run the query.
Metrics browser
The metrics browser allows you to quickly find metrics and select relevant labels to build basic queries. When you open the browser you will see all available metrics and labels. If supported by your Prometheus instance, each metric will show its HELP and TYPE as a tooltip.
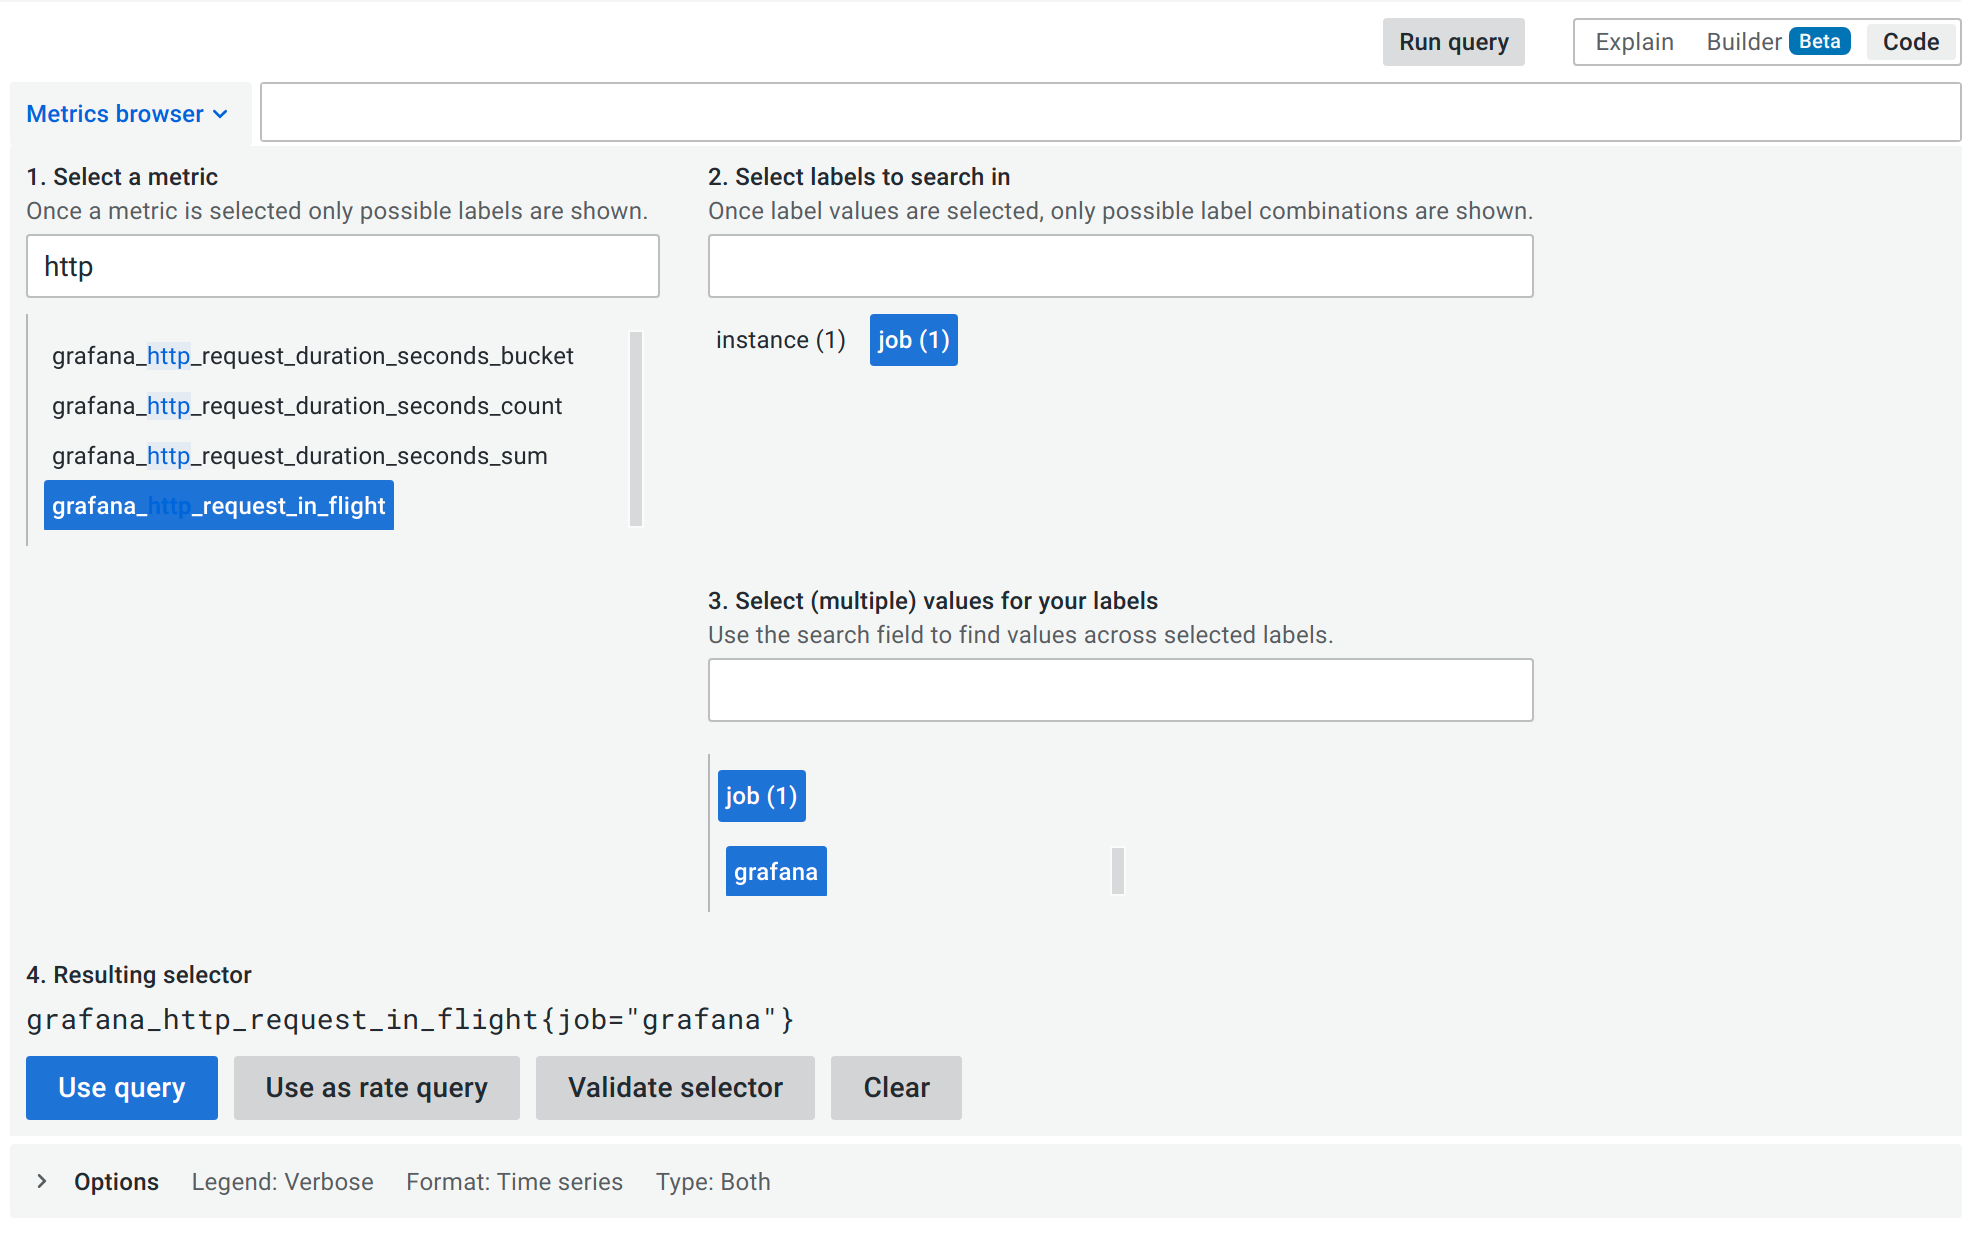
When you select a metric, the browser narrows down the available labels to show only the ones applicable to the metric. You can then select one or more labels for which the available label values are shown in lists in the bottom section. Select one or more values for each label to tighten your query scope.
Note: If you do not remember a metric name to start with, you can also select a few labels first, to narrow down the list and then find relevant label values.
All lists in the metrics browser have a search field above them to quickly filter for metrics or labels that match a certain string. The values section only has one search field. It’s filtering applies to all labels to help you find values across labels once they have been selected, for example, among your labels app, job, job_name only one might with the value you are looking for.
Once you are satisfied with your query, click “Use query” to run the query. The button “Use as rate query” adds a rate(...)[$__interval] around your query to help write queries for counter metrics.
The “Validate selector” button will check with Prometheus how many time series are available for that selector.
Options
| Name | Description |
|---|---|
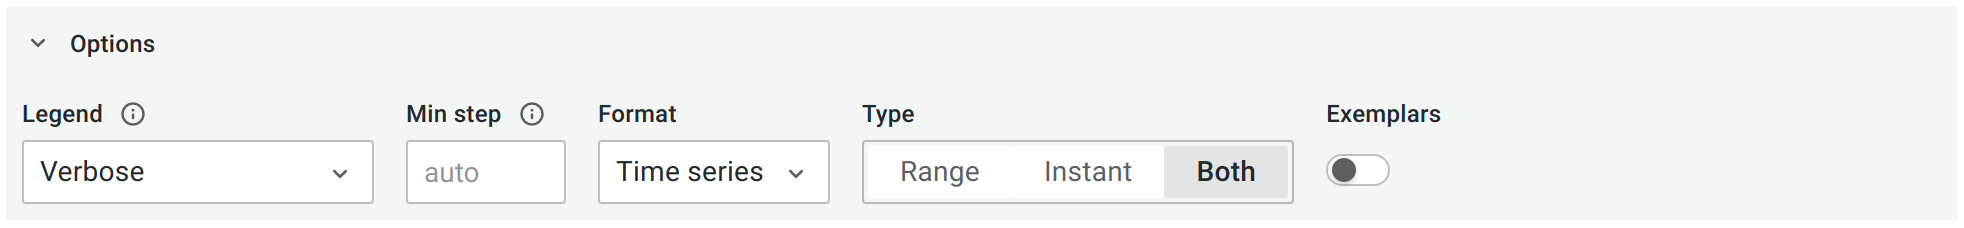
Legend | Controls the name of the time series. Use predefined format or use custom format.Auto - if there is a single label, it shows just the value of that label for each series. If there are multiple labels, it works the same as VerboseVerbose - includes all labels.Custom - select will change to text input. Use templating to select which labels will be included. For example, {{hostname}} is replaced by the label value for the label hostname. Clear the input and click outside the input to go back to select mode. |
Min step | Set the lower bounds on the interval between data points. For example, set “1h” to hint that measurements are not frequent (taken hourly). $__interval and $__rate_interval are supported. |
Format | You can switch between Table Time series or Heatmap options. The Table option works only in the Table panel. Heatmap displays metrics of the Histogram type on a Heatmap panel. Under the hood, it converts cumulative histograms to regular ones and sorts series by the bucket bound. |
Type | Range - Query returning a Range vector, a set of time series containing a range of data points over time for each time series.Instant - Perform an “instant” query to return only the latest value that Prometheus has scraped for the requested time series. Instant queries can return results much faster than normal range queries. Use them to look up label sets. Instant query results are made up only of one data point per series but can be shown in the graph panel in a dashboard with the help of series overrides. To show them in the graph as a latest value point, add a series override and select Points > true. To show a horizontal line across the whole graph, add a series override and select Transform > constant.Both - Available only in Explore. Runs both range and instant query |
Exemplars | If on, run exemplars query with the regular query and show exemplars in the graph. |
Note: Grafana modifies the request dates for queries to align them with the dynamically calculated step. This ensures consistent display of metrics data, but it can result in a small gap of data at the right edge of a graph.
Builder mode
The following video demonstrates how to use the visual Prometheus query builder available in Grafana version 9.0.
There’s supposed to be a video here, but for some reason there isn’t. Either we entered the id wrong (oops!), or Vimeo is down. If it’s the latter, we’d expect they’ll be back up and running soon. In the meantime, check out our blog!
Toolbar
In addition to Run query button and mode switcher, in builder mode additional elements are available:
| Name | Description |
|---|---|
| Query patterns | A list of useful operation patterns that can be used to quickly add multiple operations to your query to achieve a specific goal. |
| Raw query | Toggle to show raw query generated by the builder that will be sent to Prometheus instance. |
Metric and labels

Select a specific metric name from the dropdown list. List of available metrics is fetched from the Prometheus server based on selected time rage. Write into the select when the dropdown is open to search and filter the list.
Select desired labels and their values from the dropdown list. When metric is selected, available labels and their values are fetched from the server. Use the + button to add more labels. Use the x button to remove a label.
Operations
Use the + Operations button to add operation to your query. Operations are grouped into sections for easier navigation. When the operations dropdown is open, write into the search input to search and filter operations list.
Operations in a query are shown as boxes in the operations section. Each has a header with a name and additional action buttons. Hover over the operation header to show the action buttons. Click the v button to quickly replace the operation with different one of the same type. Click the info button to open operations’ description tooltip. Click the x button to remove the operation.
Operation can have additional parameters under the operation header. See the operation description or Prometheus docs for more details about each operation.
Some operations make sense only in specific order, if adding an operation would result in nonsensical query, operation will be added to the correct place. To order operations manually drag operation box by the operation name and drop in appropriate place.
Hints

In same cases the query editor can detect which operations would be most appropriate for a selected metric. In such cases it will show a hint next to the + Operations button. Click on the hint to add the operations to your query.
Raw query
This section is shown only if the Raw query switch from the query editor top toolbar is set to on. It shows the raw query that will be created and executed by the query editor.
Options
Same set of option is available as in the Code mode. See the Code mode options for details.
Explain mode
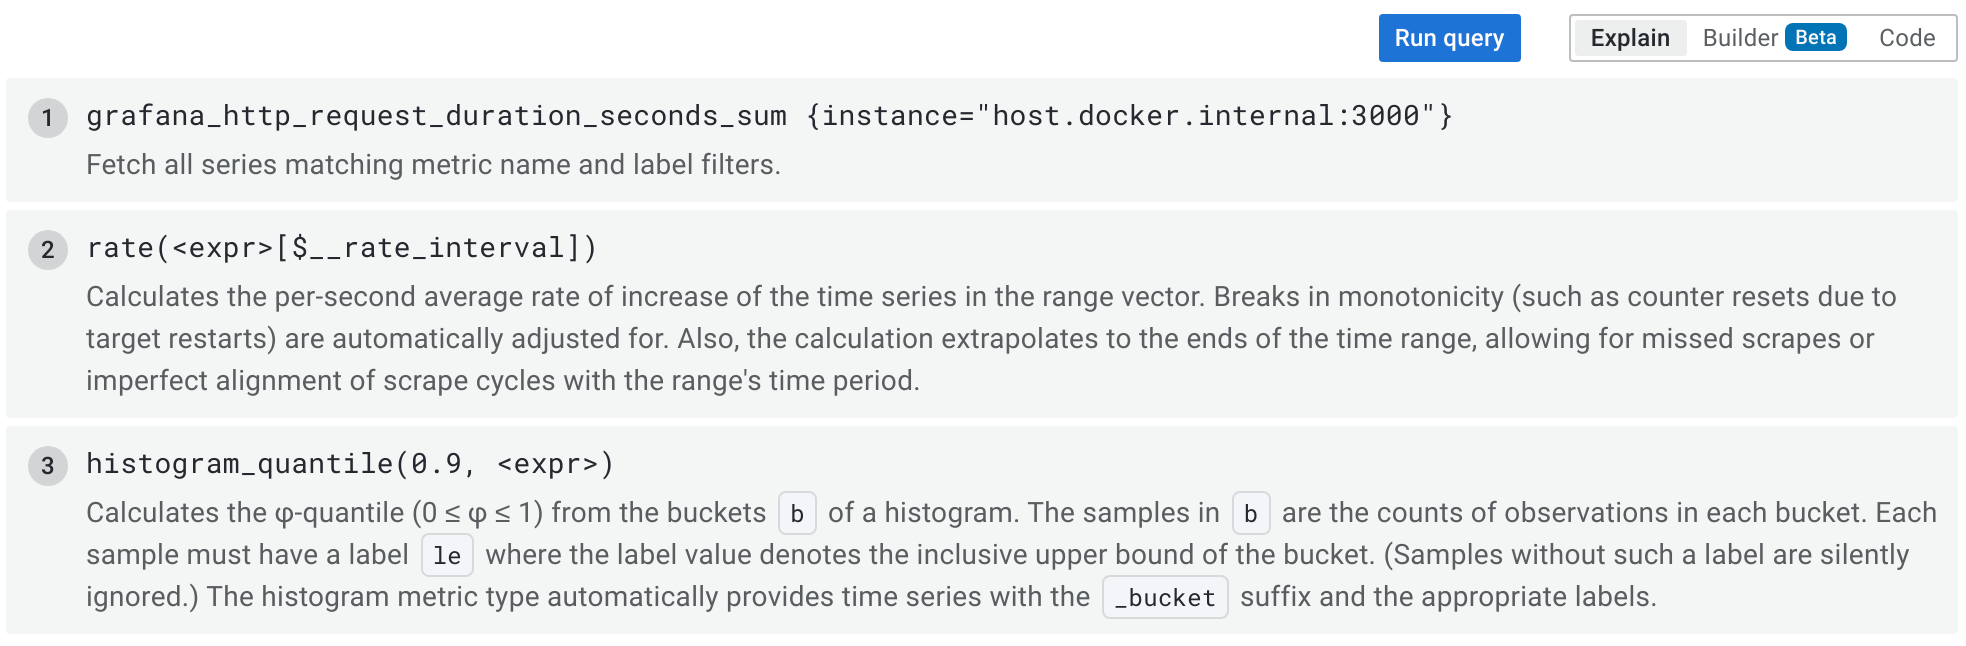
Explain mode helps with understanding the query. It shows a step by step explanation of all query parts and the operations.
Templating
Instead of hard-coding things like server, application and sensor name in your metric queries, you can use variables in their place. Variables are shown as dropdown select boxes at the top of the dashboard. These dropdowns make it easy to change the data being displayed in your dashboard.
Check out the Templating documentation for an introduction to the templating feature and the different types of template variables.
Query variable
Variable of the type Query allows you to query Prometheus for a list of metrics, labels or label values. The Prometheus data source plugin
provides the following functions you can use in the Query input field.
| Name | Description | Used API endpoints |
|---|---|---|
label_names() | Returns a list of label names. | /api/v1/labels |
label_values(label) | Returns a list of label values for the label in every metric. | /api/v1/label/label/values |
label_values(metric, label) | Returns a list of label values for the label in the specified metric. | /api/v1/series |
metrics(metric) | Returns a list of metrics matching the specified metric regex. | /api/v1/label/__name__/values |
query_result(query) | Returns a list of Prometheus query result for the query. | /api/v1/query |
For details of what metric names, label names and label values are please refer to the Prometheus documentation.
Using interval and range variables
Support for
$__range,$__range_sand$__range_msonly available from Grafana v5.3
You can use some global built-in variables in query variables, for example, $__interval, $__interval_ms, $__range, $__range_s and $__range_ms. See Global built-in variables for more information. They are convenient to use in conjunction with the query_result function when you need to filter variable queries since the label_values function doesn’t support queries.
Make sure to set the variable’s refresh trigger to be On Time Range Change to get the correct instances when changing the time range on the dashboard.
Example usage:
Populate a variable with the busiest 5 request instances based on average QPS over the time range shown in the dashboard:
Query: query_result(topk(5, sum(rate(http_requests_total[$__range])) by (instance)))
Regex: /"([^"]+)"/
Populate a variable with the instances having a certain state over the time range shown in the dashboard, using $__range_s:
Query: query_result(max_over_time(<metric>[${__range_s}s]) != <state>)
Regex:
Using $__rate_interval
Note: Available in Grafana 7.2 and above
$__rate_interval is the recommended interval to use in the rate and increase functions. It will “just work” in most cases, avoiding most of the pitfalls that can occur when using a fixed interval or $__interval.
OK:       rate(http_requests_total[5m])
Better:   rate(http_requests_total[$__rate_interval])
Details: $__rate_interval is defined as max($__interval + Scrape interval, 4 * Scrape interval), where Scrape interval is the Min step setting (AKA queryinterval, a setting per PromQL query) if any is set. Otherwise, the Scrape interval setting in the Prometheus data source is used. (The Min interval setting in the panel is modified by the resolution setting and therefore doesn’t have any effect on _Scrape interval.) This article contains additional details.
Using variables in queries
There are two syntaxes:
$<varname>Example: rate(http_requests_total{job=~"$job"}[5m])[[varname]]Example: rate(http_requests_total{job=~"[[job]]"}[5m])
Why two ways? The first syntax is easier to read and write but does not allow you to use a variable in the middle of a word. When the Multi-value or Include all value
options are enabled, Grafana converts the labels from plain text to a regex compatible string. Which means you have to use =~ instead of =.
Ad hoc filters variable
Prometheus supports the special ad hoc filters variable type. It allows you to specify any number of label/value filters on the fly. These filters are automatically applied to all your Prometheus queries.
Annotations
Annotations allow you to overlay rich event information on top of graphs. You add annotation queries via the Dashboard menu / Annotations view.
Prometheus supports two ways to query annotations.
- A regular metric query
- A Prometheus query for pending and firing alerts (for details see Inspecting alerts during runtime)
The step option is useful to limit the number of events returned from your query.
Get Grafana metrics into Prometheus
Grafana exposes metrics for Prometheus on the /metrics endpoint. We also bundle a dashboard within Grafana so you can get started viewing your metrics faster. You can import the bundled dashboard by going to the data source edit page and click the dashboard tab. There you can find a dashboard for Grafana and one for Prometheus. Import and start viewing all the metrics!
For detailed instructions, refer to Internal Grafana metrics.
Prometheus API
The Prometheus data source works with other projects that implement the Prometheus query API including:
For more information on how to query other Prometheus-compatible projects from Grafana, refer to the specific project documentation.
Provision the Prometheus data source
You can configure data sources using config files with Grafana’s provisioning system. Read more about how it works and all the settings you can set for data sources on the provisioning docs page.
Here are some provisioning examples for this data source:
apiVersion: 1

datasources:
  - name: Prometheus
    type: prometheus
    # Access mode - proxy (server in the UI) or direct (browser in the UI).
    access: proxy
    url: http://localhost:9090
    jsonData:
      httpMethod: POST
      exemplarTraceIdDestinations:
        # Field with internal link pointing to data source in Grafana.
        # datasourceUid value can be anything, but it should be unique across all defined data source uids.
        - datasourceUid: my_jaeger_uid
          name: traceID

        # Field with external link.
        - name: traceID
          url: 'http://localhost:3000/explore?orgId=1&left=%5B%22now-1h%22,%22now%22,%22Jaeger%22,%7B%22query%22:%22$${__value.raw}%22%7D%5D'
Amazon Managed Service for Prometheus
The Prometheus data source works with Amazon Managed Service for Prometheus. If you are using an AWS Identity and Access Management (IAM) policy to control access to your Amazon Managed Service for Prometheus domain, then you must use AWS Signature Version 4 (AWS SigV4) to sign all requests to that domain. For more details on AWS SigV4, refer to the AWS documentation.
Note: Grafana version 7.3.5 or higher is required to use SigV4 authentication.
To connect the Prometheus data source to Amazon Managed Service for Prometheus using SigV4 authentication, refer to the AWS guide to Set up Grafana open source or Grafana Enterprise for use with AMP.
If you are running Grafana in an Amazon EKS cluster, follow the AWS guide to Query using Grafana running in an Amazon EKS cluster.
Configuring exemplars
Note: This feature is available in Prometheus 2.26+ and Grafana 7.4+.
Grafana 7.4 and later versions have the capability to show exemplars data alongside a metric both in Explore and Dashboards.
Exemplars are a way to associate higher cardinality metadata from a specific event with traditional timeseries data.
Configure Exemplars in the data source settings by adding external or internal links.
Was this page helpful?
Related resources from Grafana Labs