
Important: This documentation is about an older version. It's relevant only to the release noted, many of the features and functions have been updated or replaced. Please view the current version.
Using Graphite in Grafana
Grafana has an advanced Graphite query editor that lets you quickly navigate the metric space, add functions, change function parameters and much more. The editor can handle all types of graphite queries. It can even handle complex nested queries through the use of query references.
Refer to Add a data source for instructions on how to add a data source to Grafana. Only organization admins can add data sources. To learn more about the Graphite data source, refer to Graphite’s product documentation.
Graphite settings
To access Graphite settings, hover your mouse over the Configuration (gear) icon, then click Data Sources, and then click the Graphite data source.
| Name | Description |
|---|---|
Name | The data source name. This is how you refer to the data source in panels and queries. |
Default | Default data source means that it will be pre-selected for new panels. |
URL | The HTTP protocol, IP, and port of your graphite-web or graphite-api install. |
Auth | Refer to Authentication for more information. |
Basic Auth | Enable basic authentication to the data source. |
User | User name for basic authentication. |
Password | Password for basic authentication. |
Custom HTTP Headers | Click Add header to add a custom HTTP header. |
Header | Enter the custom header name. |
Value | Enter the custom header value. |
Graphite details | |
Version | Select your version of Graphite. |
Type | Select your type of Graphite. |
Graphite query editor
Grafana includes a Graphite-specific query editor to help you build your queries.
To see the raw text of the query that is sent to Graphite, click the Toggle text edit mode (pencil) icon.
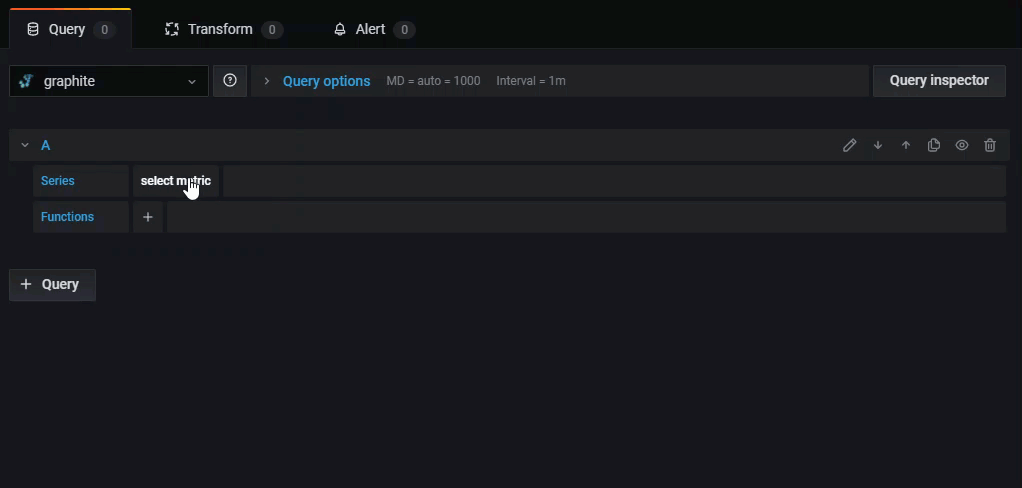
Choose metrics to query
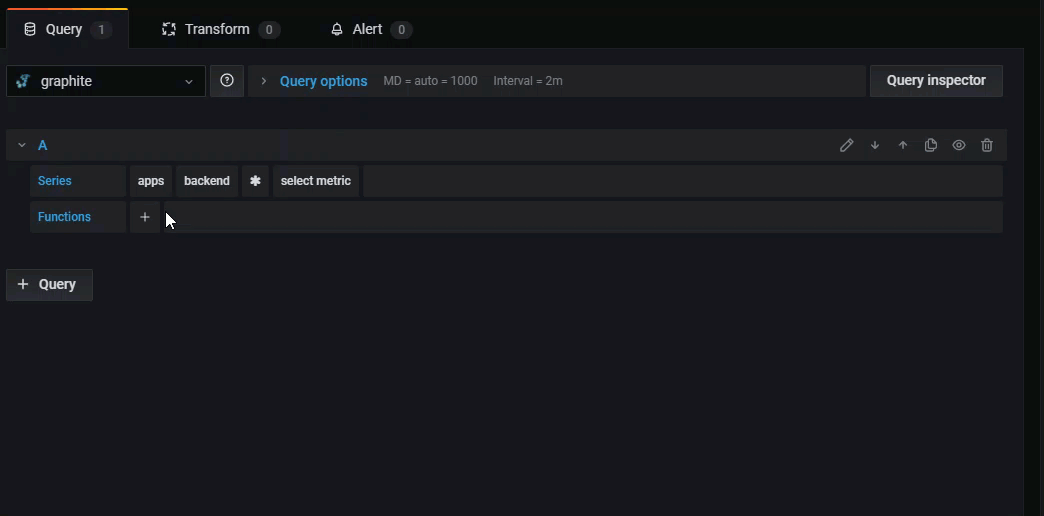
Click Select metric to start navigating the metric space. Once you start, you can continue using the mouse or keyboard arrow keys. You can select a wildcard and still continue.
Functions
Click the plus icon next to Function to add a function. You can search for the function or select it from the menu. Once a function is selected, it will be added and your focus will be in the text box of the first parameter.
- To edit or change a parameter, click on it and it will turn into a text box.
- To delete a function, click the function name followed by the x icon.
Some functions like aliasByNode support an optional second argument. To add an argument, hover your mouse over the first argument and then click the + symbol that appears. To remove the second optional parameter, click on it and leave it blank and the editor will remove it.
To learn more, refer to Graphite’s documentation on functions.
Sort labels
If you want consistent ordering, use sortByName. This can be particularly annoying when you have the same labels on multiple graphs, and they are both sorted differently and using different colors. To fix this, use sortByName().
Nested queries
You can reference queries by the row “letter” that they’re on (similar to Microsoft Excel). If you add a second query to a graph, you can reference the first query simply by typing in #A. This provides an easy and convenient way to build compounded queries.
Avoiding many queries by using wildcards
Occasionally one would like to see multiple time series plotted on the same graph. For example we might want to see how the CPU is being utilized on a machine. You might
initially create the graph by adding a query for each time series, such as cpu.percent.user.g,
cpu.percent.system.g, and so on. This results in n queries made to the data source, which is inefficient.
To be more efficient one can use wildcards in your search, returning all the time series in one query. For example, cpu.percent.*.g.
Modify the metric name in my tables or charts
Use alias functions to change metric names on Grafana tables or graphs For example aliasByNode() or aliasSub().
Point consolidation
All Graphite metrics are consolidated so that Graphite doesn’t return more data points than there are pixels in the graph. By default,
this consolidation is done using avg function. You can control how Graphite consolidates metrics by adding the Graphite consolidateBy function.
Note: This means that legend summary values (max, min, total) cannot all be correct at the same time. They are calculated client-side by Grafana. And depending on your consolidation function, only one or two can be correct at the same time.
Combine time series
To combine time series, click Combine in the Functions list.
Data exploration and tags
In Graphite, everything is a tag.
When exploring data, previously-selected tags are used to filter the remaining result set. To select data, you use the
seriesByTag function, which takes tag expressions (=, !=, =~, !=~) to filter timeseries.
The Grafana query builder does this for you automatically when you select a tag.
Tip: The regular expression search can be quite slow on high-cardinality tags, so try to use other tags to reduce the scope first. Starting off with a particular name/namespace can help reduce the results.
Template variables
Instead of hard-coding things like server, application, and sensor name in your metric queries, you can use variables in their place. Variables are shown as drop-down select boxes at the top of the dashboard. These dropdowns make it easy to change the data being displayed in your dashboard.
For more information, refer to Variables and templates.
Graphite 1.1 introduced tags and Grafana added support for Graphite queries with tags in version 5.0. To create a variable using tag values, use the Grafana functions tags and tag_values.
| Query | Description |
|---|---|
tags() | Returns all tags. |
tags(server=~backend\*) | Returns only tags that occur in series matching the filter expression. |
tag_values(server) | Return tag values for the specified tag. |
tag_values(server, server=~backend\*) | Returns filtered tag values that occur for the specified tag in series matching those expressions. |
tag_values(server, server=~backend\*, app=~${apps:regex}) | Multiple filter expressions and expressions can contain other variables. |
For more details, see the Graphite docs on the autocomplete API for tags.
Query variable
The query you specify in the query field should be a metric find type of query. For example, a query like prod.servers.* fills the
variable with all possible values that exist in the wildcard position.
The results contain all possible values occurring only at the last level of the query. To get full metric names matching the query
use expand function (expand(*.servers.*)).
Comparison between expanded and non-expanded metric search results
The expanded query returns the full names of matching metrics. In combination with regex, it can extract any part of the metric name. By contrast, a non-expanded query only returns the last part of the metric name. It does not allow you to extract other parts of metric names.
Here are some example metrics:
prod.servers.001.cpuprod.servers.002.cputest.servers.001.cpu
The following examples show how expanded and non-expanded queries can be used to fetch specific parts of the metrics name.
| non-expanded query | results | expanded query | expanded results |
|---|---|---|---|
* | prod, test | expand(*) | prod, test |
*.servers | servers | expand(*.servers) | prod.servers, test.servers |
test.servers | servers | expand(test.servers) | test.servers |
*.servers.* | 001,002 | expand(*.servers.*) | prod.servers.001, prod.servers.002, test.servers.001 |
test.servers.* | 001 | expand(test.servers.*) | test.servers.001 |
*.servers.*.cpu | cpu | expand(*.servers.*.cpu) | prod.servers.001.cpu, prod.servers.002.cpu, test.servers.001.cpu |
As you can see from the results, the non-expanded query is the same as an expanded query with a regex matching the last part of the name.
You can also create nested variables that use other variables in their definition. For example
apps.$app.servers.* uses the variable $app in its query definition.
Using __searchFilter to filter query variable results
Available from Grafana 6.5 and above
Using __searchFilter in the query field will filter the query result based on what the user types in the dropdown select box.
When nothing has been entered by the user the default value for __searchFilter is * and `` when used as part of a regular expression.
The example below shows how to use __searchFilter as part of the query field to enable searching for server while the user types in the dropdown select box.
Query
apps.$app.servers.$__searchFilterTagValues
tag_values(server, server=~${__searchFilter:regex})Variable usage
You can use a variable in a metric node path or as a parameter to a function.

There are two syntaxes:
$<varname>Example: apps.frontend.$server.requests.count${varname}Example: apps.frontend.${server}.requests.count
Why two ways? The first syntax is easier to read and write but does not allow you to use a variable in the middle of a word. Use
the second syntax in expressions like my.server${serverNumber}.count.
Example: Graphite Templated Dashboard
Variable usage in tag queries
Multi-value variables in tag queries use the advanced formatting syntax introduced in Grafana 5.0 for variables: {var:regex}. Non-tag queries will use the default glob formatting for multi-value variables.
Example of a tag expression with regex formatting and using the Equal Tilde operator, =~:
server=~${servers:regex}For more information, refer to Advanced variable format options.
Annotations
Annotations allow you to overlay rich event information on top of graphs. You add annotation queries via the Dashboard menu / Annotations view.
Graphite supports two ways to query annotations. A regular metric query, for this you use the Graphite query textbox. A Graphite events query, use the Graphite event tags textbox,
specify a tag or wildcard (leave empty should also work)
Get Grafana metrics into Graphite
Grafana exposes metrics for Graphite on the /metrics endpoint. For detailed instructions, refer to Internal Grafana metrics.
Configure the data source with provisioning
It’s now possible to configure data sources using config files with Grafana’s provisioning system. You can read more about how it works and all the settings you can set for data sources on the provisioning docs page
Here are some provisioning examples for this data source.
apiVersion: 1

datasources:
  - name: Graphite
    type: graphite
    access: proxy
    url: http://localhost:8080
    jsonData:
      graphiteVersion: '1.1'
Integration with Loki
Graphite queries get converted to Loki queries when the data source selection changes in Explore. Loki label names and values are extracted from the Graphite queries according to mappings information provided in Graphite data source configuration. Queries using tags with seriesByTags() are also transformed without any additional setup.
Refer to the Graphite data source settings for more details.
Was this page helpful?
Related resources from Grafana Labs


