
Important: This documentation is about an older version. It's relevant only to the release noted, many of the features and functions have been updated or replaced. Please view the current version.
Add and organize panels
This section describes the areas of the Grafana panel editor.
Panel header: The header section lists the dashboard in which the panel appears and the following controls:
- Dashboard settings (gear) icon: Click to access the dashboard settings.
- Discard: Discards changes you have made to the panel since you last saved the dashboard.
- Save: Saves changes you made to the panel.
- Apply: Applies changes you made and closes the panel editor, returning you to the dashboard. You will have to save the dashboard to persist the applied changes.
Visualization preview: The visualization preview section contains the following options:
- Table view: Convert any visualization to a table so that you can see the data. Table views are useful for troubleshooting.
- Fill: The visualization preview fills the available space. If you change the width of the side pane or height of the bottom pane the visualization changes to fill the available space.
- Actual: The visualization preview will have the exact size as the size on the dashboard. If not enough space is available, the visualization will scale down preserving the aspect ratio.
- Time range controls: For more information, refer to Time range controls.
Data section: The data section contains tabs where you enter queries, transform your data, and create alert rules (if applicable).
- Query tab: Select your data source and enter queries here. For more information, refer to Add a query.
- Transform tab: Apply data transformations. For more information, refer to Transform data.
- Alert tab: Write alert rules. For more information, refer to Overview of Grafana 8 alerting.
Panel display options: The display options section contains tabs where you configure almost every aspect of your data visualization.
Not all options are available for each visualization.
Open the panel inspect drawer
The inspect drawer helps you understand and troubleshoot your panels. You can view the raw data for any panel, export that data to a comma-separated values (CSV) file, view query requests, and export panel and data JSON.
Note: Not all panel types include all tabs. For example, dashboard list panels do not have raw data to inspect, so they do not display the Stats, Data, or Query tabs.
The panel inspector consists of the following options:
The panel inspect drawer displays opens a drawer on the right side. Click the arrow in the upper right corner to expand or reduce the drawer pane.
Data tab - Shows the raw data returned by the query with transformations applied. Field options such as overrides and value mappings are not applied by default.
Stats tab - Shows how long your query takes and how much it returns.
JSON tab - Allows you to view and copy the panel JSON, panel data JSON, and data frame structure JSON. This is useful if you are provisioning or administering Grafana.
Query tab - Shows you the requests to the server sent when Grafana queries the data source.
Error tab - Shows the error. Only visible when query returns error.
Create a dashboard and add a panel
Dashboards and panels allow you to show your data in visual form. Each panel needs at least one query to display a visualization.
Before you begin:
- Ensure that you have the proper permissions. For more information about permissions, refer to About users and permissions.
- Identify the dashboard to which you want to add the panel.
- Understand the query language of the target data source.
- Ensure that data source for which you are writing a query has been added. For more information about adding a data source, refer to Add a data source if you need instructions.
To create a dashboard and add a panel:
Sign in to Grafana, hover your cursor over Dashboard, and click + New Dashboard.
Click Add a new panel.
In the first line of the Query tab, click the drop-down list and select a data source.
Write or construct a query in the query language of your data source.
For more information about data sources, refer to Data sources for specific guidelines.
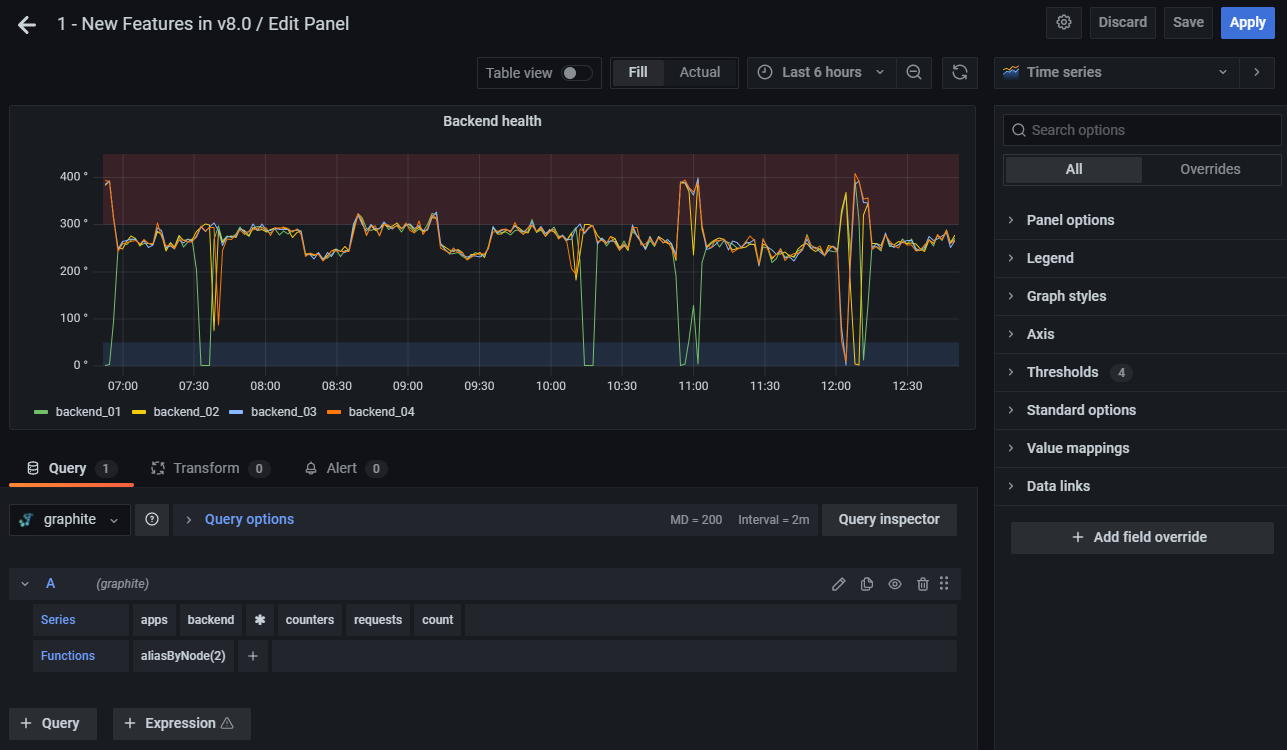
In the Visualization list, select a visualization type.
Grafana displays a preview of your query results with the visualization applied.
![]()
For more information about individual visualizations, refer to Visualizations options.
Refer to the following documentation for ways you can adjust panel settings.
While not required, most visualizations need some adjustment before they properly display the information that you need.
Add a note to describe the visualization (or describe your changes) and then click Save in the upper-right corner of the page.
Notes can be helpful if you need to revert the dashboard to a previous version.
Configure repeating rows
You can configure Grafana to dynamically add panels or rows to a dashboard based on the value of a variable. Variables dynamically change your queries across all rows in a dashboard. For more information about repeating panels, refer to Configure repeating panels.
To see an example of repeating rows, refer to Dashboard with repeating rows. The example shows that you can also repeat rows if you have variables set with Multi-value or Include all values selected.
Before you begin:
- Ensure that the query includes a multi-value variable.
To configure repeating rows:
On the dashboard home page, click Add panel.
On the Add a panel dialog box, click Add a new row.
Hover over the row title and click the cog icon.
On the Row Options dialog box, add a title and select the variable for which you want to add repeating rows.
Note: To provide context to dashboard users, add the variable to the row title.
Was this page helpful?
Related resources from Grafana Labs


