Important: This documentation is about an older version. It's relevant only to the release noted, many of the features and functions have been updated or replaced. Please view the current version.
Introduction to exemplars
An exemplar is a specific trace representative of measurement taken in a given time interval. While metrics excel at giving you an aggregated view of your system, traces give you a fine grained view of a single request; exemplars are a way to link the two.
Suppose your company website is experiencing a surge in traffic volumes. While more than eighty percent of the users are able to access the website in under two seconds, some users are experiencing a higher than normal response time resulting in bad user experience.
To identify the factors that are contributing to the latency, you must compare a trace for a fast response against a trace for a slow response. Given the vast amount of data in a typical production environment, it will be extremely laborious and time-consuming effort.
Use exemplars to help isolate problems within your data distribution by pinpointing query traces exhibiting high latency within a time interval. Once you localize the latency problem to a few exemplar traces, you can combine it with additional system based information or location properties to perform a root cause analysis faster, leading to quick resolutions to performance issues.
Support for exemplars is available for the Prometheus data source only. Once you enable the functionality, exemplars data is available by default. For more information on exemplar configuration and how to enable exemplars, refer to configuring exemplars in Prometheus data source.
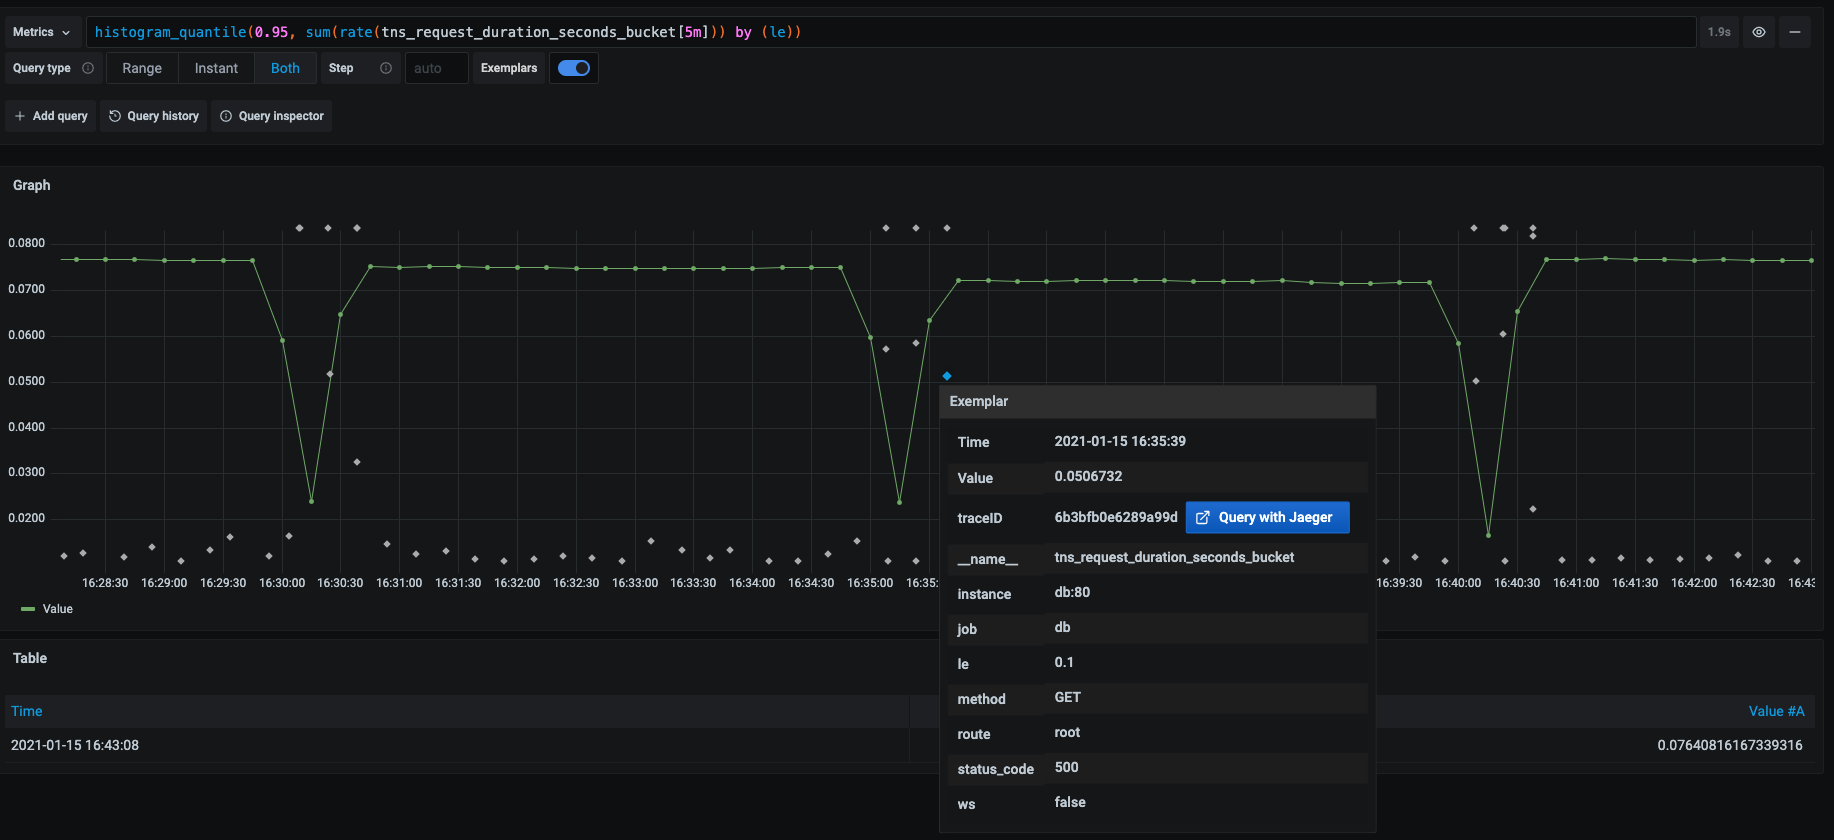
Grafana shows exemplars alongside a metric in the Explore view and in dashboards. Each exemplar displays as a highlighted star. You can hover your cursor over an exemplar to view the unique traceID, which is a combination of a key value pair. To investigate further, click the blue button next to the traceID property.

Refer to View exemplar data for instructions on how to drill down and view exemplar trace details from metrics and logs. To know more about exemplars, refer to the blogpost Intro to exemplars, which enable Grafana Tempo’s distributed tracing at massive scale.


