
Important: This documentation is about an older version. It's relevant only to the release noted, many of the features and functions have been updated or replaced. Please view the current version.
Navigate the Grafana panel editor
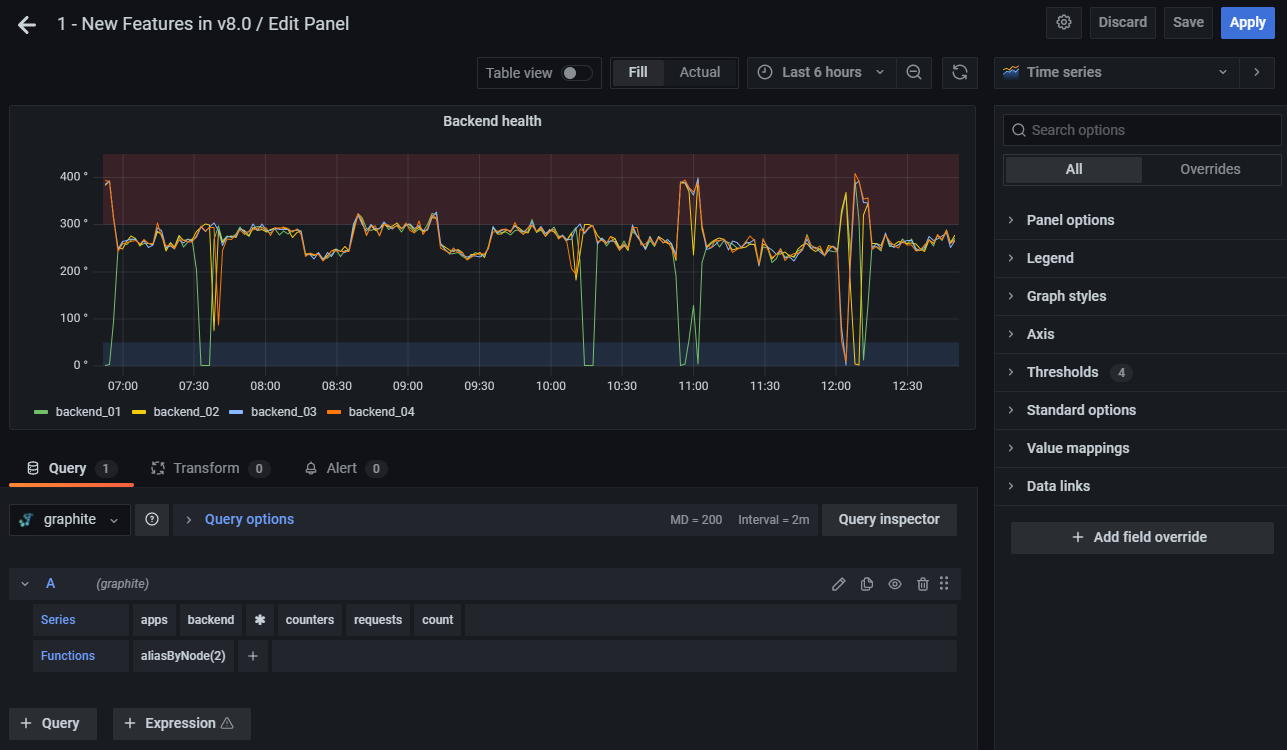
This page describes the parts of the Grafana panel editor.
Panel header: The header section lists the dashboard in which the panel appears and the following controls:
- Dashboard settings (gear) icon - Click to access the dashboard settings.
- Discard - Discards changes you have made to the panel since you last saved the dashboard.
- Save - Saves changes you made to the panel.
- Apply - Applies changes you made and closes the panel editor, returning you to the dashboard. You will have to save the dashboard to persist the applied changes.
Visualization preview: The visualization preview section contains the following options:
- Table view - Convert any visualization to a table so that you can see the data. Table views are useful for troubleshooting.
- Fill - The visualization preview fills the available space. If you change the width of the side pane or height of the bottom pane the visualization changes to fill the available space.
- Actual - The visualization preview will have the exact size as the size on the dashboard. If not enough space is available, the visualization will scale down preserving the aspect ratio.
- Time range controls - For more information, refer to Time range controls.
Data section: The data section contains tabs where you enter queries, transform your data, and create alert rules (if applicable).
Query tab - Select your data source and enter queries here. For more information, refer to Add a query.
Transform tab - Apply data transformations. For more information, refer to Transform data.
Alert tab - Write alert rules. For more information, refer to Overview of Grafana 8 alerting.
Panel display options: The display options section contains tabs where you configure almost every aspect of your data visualization, including:
Not all options are available for each visualization.
Was this page helpful?
Related resources from Grafana Labs


