
Important: This documentation is about an older version. It's relevant only to the release noted, many of the features and functions have been updated or replaced. Please view the current version.
Add a panel to a dashboard
Panels allow you to show your data in visual form. Each panel needs at least one query to display a visualization.
Before you begin
- Ensure that you have the proper permissions. For more information about permissions, refer to About users and permissions.
- Identify the dashboard to which you want to add the panel.
- Understand the query language of the target data source.
- Ensure that data source for which you are writing a query has been added. For more information about adding a data source, refer to Add a data source if you need instructions.
To add a panel to a dashboard:
Navigate to the dashboard to which you want to add a panel.
Click the Add panel icon.
![]()
Click Add an empty panel.
Grafana creates an empty time-series panel and selects the default data source.
In the first line of the Query tab, click the drop-down list and select a data source.
Write or construct a query in the query language of your data source.
For more information about data sources, refer to Data sources for specific guidelines.
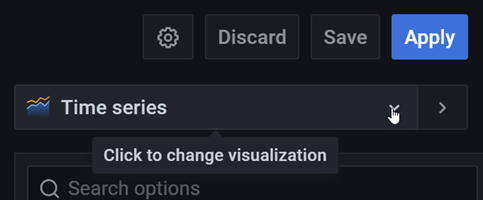
In the Visualization list, select a visualization type.
Grafana displays a preview of your query results with the visualization applied.
![]()
For more information about individual visualizations, refer to Visualizations options.
Refer to the following documentation for ways you adjust panel settings.
While not required, most visualizations need some adjustment before they properly display the information that you need.
Add a note to describe the visualization (or describe your changes) and then click Save in the upper-right corner of the page.
Notes can be helpful if you need to revert the dashboard to a previous version.
Was this page helpful?
Related resources from Grafana Labs


