Menu
Important: This documentation is about an older version. It's relevant only to the release noted, many of the features and functions have been updated or replaced. Please view the current version.
Enterprise
Open source
Navigate the query tab
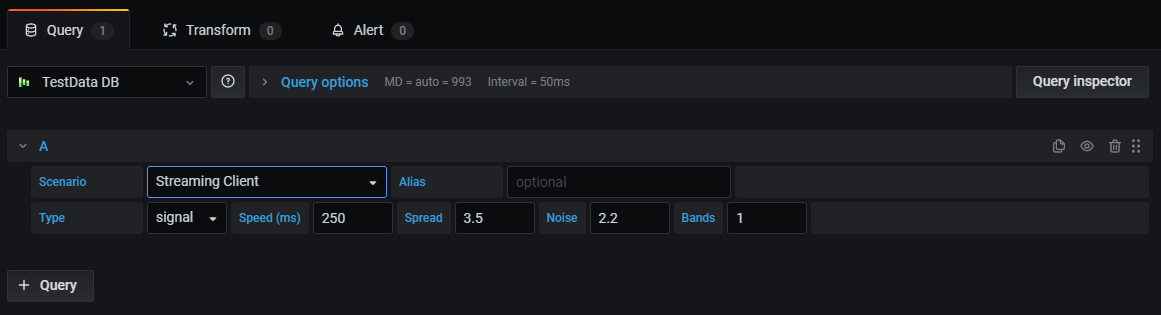
The Query tab consists of the following elements:
- Data source selector: Use the data source selector to select the source of the data you want to query. For more information about data sources, refer to Data sources.
- Query options: Enables you to set maximum data retrieved parameters and query execution time intervals.
- Query inspector button: Open the query inspector panel where you can view and optimize your query.
- Query editor list: Lists the queries you have written.
- Expressions: Use the expression builder to create alert expressions. For more information about expressions, refer to Use expressions to manipulate data.