Important: This documentation is about an older version. It's relevant only to the release noted, many of the features and functions have been updated or replaced. Please view the current version.
Create a Grafana library panel
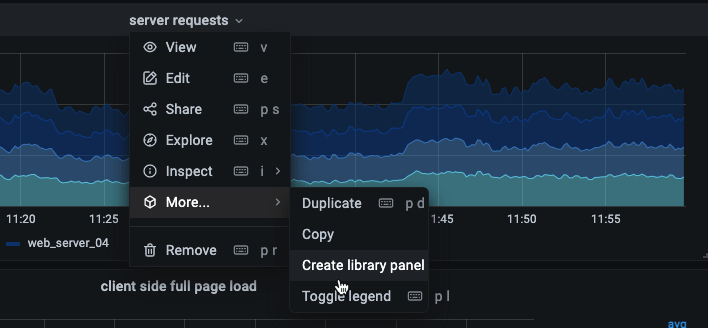
When you create a library panel, the panel on the source dashboard is converted to a library panel as well. You need to save the original dashboard once a panel is converted.
Before you begin
To create a library panel:
- Open a panel in edit mode.
- In the panel display options, click the down arrow option to bring changes to the visualization.
![Screenshot of the edit panel Screenshot of the edit panel]()
Screenshot of the edit panel - Click the Library panels option, and then click Create new library panel to open the create dialog.
![Screenshot of the create library panel dialog Screenshot of the create library panel dialog]()
Screenshot of the create library panel dialog - In Library panel name, enter the name.
- In Save in folder, select the folder to save the library panel.
- Click Create library panel to save your changes.
- Save the dashboard.
Once created, you can modify the library panel using any dashboard on which it appears. After you save the changes, all instances of the library panel reflect these modifications.


