
Menu
Important: This documentation is about an older version. It's relevant only to the release noted, many of the features and functions have been updated or replaced. Please view the current version.
Enterprise
Open source
Map a range
Map a range of values when you want to format multiple, continuous values.
Before you begin
To map a range:
- Edit the panel for which you want to map a range of values.
- In panel display options, in the Value mappings section, click Add value mappings.
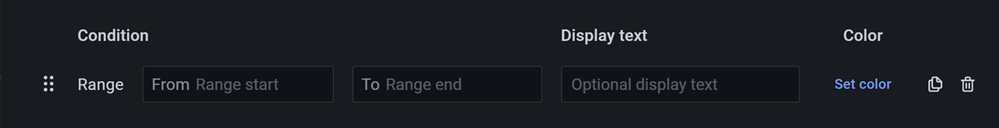
- Click Add a new mapping and then select Range.
- Enter the beginning and ending values in the range for Grafana to match.
- (Optional) Enter display text.
- (Optional) Set the color.
- Click Update to save the value mapping.
Was this page helpful?
Related resources from Grafana Labs

Getting started with the Grafana LGTM Stack
In this webinar, we’ll demo how to get started using the LGTM Stack: Loki for logs, Grafana for visualization, Tempo for traces, and Mimir for metrics.

Getting started with Grafana dashboard design
In this webinar, you'll learn how to design stylish and easily accessible Grafana dashboards that tell a story.

Building advanced Grafana dashboards
In this webinar, we’ll demo how to build and format Grafana dashboards.