Menu
Scroll for more
Important: This documentation is about an older version. It's relevant only to the release noted, many of the features and functions have been updated or replaced. Please view the current version.
Enterprise
Open source
Curated CloudWatch dashboards
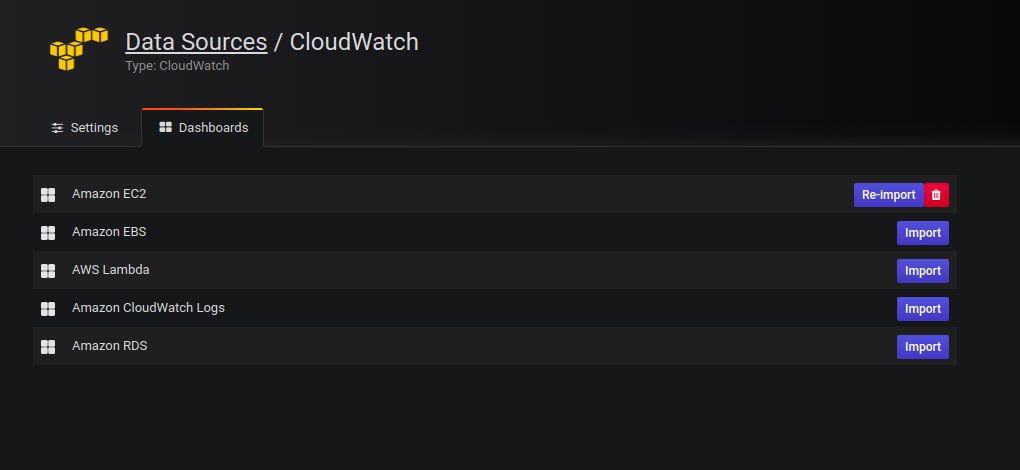
The updated CloudWatch data source ships with pre-configured dashboards for five of the most popular AWS services:
- Amazon Elastic Compute Cloud
Amazon EC2, - Amazon Elastic Block Store
Amazon EBS, - AWS Lambda
AWS Lambda, - Amazon CloudWatch Logs
Amazon CloudWatch Logs, and - Amazon Relational Database Service
Amazon RDS.
To import curatedd dashboards:
On the configuration page of your CloudWatch data source, click the Dashboards tab.
Click Import for the dashboard you would like to use.
In case you want to customize a dashboard, we recommend that you save it under a different name. Otherwise the dashboard will be overwritten when a new version of the dashboard is released.

Was this page helpful?
Related resources from Grafana Labs
Additional helpful documentation, links, and articles:
Video

Getting started with managing your metrics, logs, and traces using Grafana
In this webinar, we’ll demo how to get started using the LGTM Stack: Loki for logs, Grafana for visualization, Tempo for traces, and Mimir for metrics.
Video

Getting started with Grafana dashboard design
In this webinar, you'll learn how to design stylish and easily accessible Grafana dashboards that tell a story.
Video

Building advanced Grafana dashboards
In this webinar, we’ll demo how to build and format Grafana dashboards.