Important: This documentation is about an older version. It's relevant only to the release noted, many of the features and functions have been updated or replaced. Please view the current version.
What’s new in Grafana v6.5
For all details, read the full CHANGELOG.md.
Highlights
Grafana 6.5 comes with a lot of new features and enhancements:
- Docker: Ubuntu-based images and more
- CloudWatch: Major rewrite and lots of enhancements
- Templating: Dynamic typeahead queries using $__searchFilter
- Graphite: Support for additional Metrictank functionality
- Explore: New log row details view
- Explore: Turn parts of log message into a link using derived fields
- Explore: Time-sync of split views
- Explore: Hover/tooltip support in graphs
- Azure Monitor: Alerting support for Azure Application Insights
- Provisioning: Allow saving of provisioned dashboards from UI
- Auth Proxy: Mix auth proxy with Grafana login token and session cookie
- OAuth: Generic OAuth now supports role mapping
- Image Rendering: Quick update since Grafana 6.4
Ubuntu-based Docker images
In Grafana v6.4, we switched the Grafana Docker image from Ubuntu to Alpine. This change provides a more secure and lightweight Docker image.
This change has received both negative and positive feedback as well as some bug reports. We learned that switching to an Alpine-based Docker image was a big breaking change for a lot of users. We should have more clearly highlighted this in blog post, release notes, changelog, and the Docker Hub readme.
We also broke the Docker images for ARM, but this is fixed in Grafana v6.5.
Grafana Docker images should be as secure as possible by default and that’s why the Alpine-based Docker images will continue to be the Grafana default (grafana/grafana:<version>). With that said, it’s good to give users options, and that’s why starting from Grafana v6.5, Ubuntu-based Docker images are also (grafana/grafana:<version>-ubuntu) available.
Read more about Installing using Docker.
CloudWatch data source improvements
In this release, several feature improvements and additions were made in the CloudWatch data source. This work has been done in collaboration with the Amazon CloudWatch team.
GetMetricData API
For Grafana version 6.5 or higher, all API requests to GetMetricStatistics have been replaced with calls to GetMetricData, following Amazon’s best practice to use the GetMetricData API instead of GetMetricStatistics, because data can be retrieved faster at scale with GetMetricData. This change provides better support for CloudWatch metric math and enables the use of automatic search expressions.
While GetMetricStatistics qualified for the CloudWatch API free tier, this is not the case for GetMetricData calls. For more information, please refer to the CloudWatch pricing page.
Dynamic queries using dimension wildcards
In Grafana 6.5 or higher, you can monitor a dynamic list of metrics by using the asterisk (*) wildcard for one or more dimension values.

The example queries all metrics in the namespace AWS/EC2 with a metric name of CPUUtilization and any value for the InstanceId dimension. This can help you monitor metrics for AWS resources, like EC2 instances or containers. For example, when new instances get created as part of an auto scaling event, they automatically appear in the graph without you having to track new instance IDs. You can click Show Query Preview to see the search expression that is automatically built to support wildcards. To learn more about search expressions, visit the CloudWatch documentation.
By default, the search expression is defined in such a way that the queried metrics must match the defined dimension names exactly. This means that in the example it only returns metrics with exactly one dimension with name ‘InstanceId’.
You can untoggle Match Exact to include metrics that have other dimensions defined. Turning off Match Exact also creates a search expression even if you don’t use wildcards. We simply search for any metric that match at least the namespace, metric name, and all defined dimensions.
Deep linking from Grafana panels to the CloudWatch console

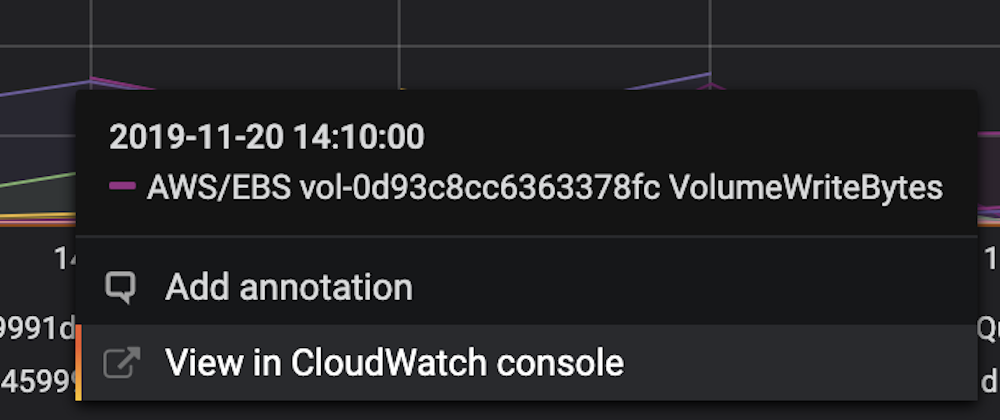
Left-clicking a time series in the panel displays a context menu with a link to View in CloudWatch console. Clicking that link opens the CloudWatch console and displays all the metrics for that query. If you are not currently logged in to the CloudWatch console, then the link opens the login page. The link is valid for any account, but it only displays the right metrics if you are logged in to the account that corresponds to the selected data source in Grafana.
This feature is not available for metrics based on math expressions.
Improved feedback when throttling occurs
If the limit of the GetMetricData API is reached, either the transactions per second limit or the data points per second limit, then a throttling error will be returned by the CloudWatch API. Throttling limits are defined per account and region, so the alert modal indicates which data source got throttled in which region. A link to request a limit increase for the affected region is provided, but you will have to log in to the correct account. For example, for us-east-1, a limit increase can be requested on AWS console.
Multi-value template variables now use search expressions
When defining dimension values based on multi-valued template variables, we now use search expressions to query for the matching metrics. This enables the use of multiple template variables in one query and also allows you to use template variables for queries that have the Match Exact option disabled.
Search expressions are currently limited to 1024 characters, so your query may fail if you have a long list of values. We recommend using the asterisk (*) wildcard instead of the All option if you want to query all metrics that have any value for a certain dimension name.
The use of multi-valued template variables is only supported for dimension values. Using multi-valued template variables for Region, Namespace, or Metric Name is not supported.
Curated Dashboards
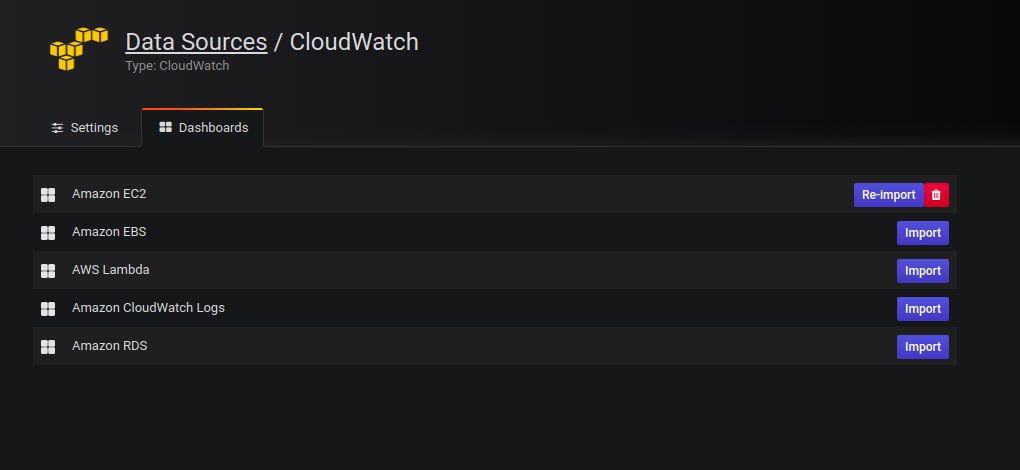
The updated CloudWatch data source is shipped with pre-configured dashboards for five of the most popular AWS services:
- Amazon Elastic Compute Cloud
Amazon EC2 - Amazon Elastic Block Store
Amazon EBS - AWS Lambda
AWS Lambda - Amazon CloudWatch Logs
Amazon CloudWatch Logs - Amazon Relational Database Service
Amazon RDS
To import the pre-configured dashboards, go to the configuration page of your CloudWatch data source and click on the Dashboards tab. Click Import for the dashboard you would like to use. To customize the dashboard, we recommend to save the dashboard under a different name, because otherwise the dashboard will be overwritten when a new version of the dashboard is released.

Dynamic typeahead support in query variables
If you have a query variable that has many thousands of values it can be quite slow to search for a specific value in the dropdown. This is due to the fact that all that search filtering is happening in the browser.
Using __searchFilter in the template variable query field you can filter the query results based on what the user types in the variable dropdown input. When nothing has been entered by the user the default value for __searchFilter is * , .* or % depending on data source and formatting option.
The example below shows how to use __searchFilter as part of the query field to enable searching for server while the user types in the dropdown select box.
Query
apps.$app.servers.$__searchFilterTagValues
tag_values(server, server=~${__searchFilter:regex})This feature is currently only supported by Graphite, MySQL and Postgres data sources.
Graphite: Support for additional Metrictank functionality
The Graphite data source now has an option to enable extra functionality when using Metrictank as a Graphite datastore. In the Datasource configuration for Graphite, you can change the type to Metrictank. Metrictank returns 2 kinds of additional metadata along its responses:
- Performance information: Time spent querying index, fetching data, running processing functions, the number of series and points fetched, cache hits/misses, etc. This can be useful for optimizing queries or tuning the chunk cache.
- Lineage information about the returned series: Which archive was fetched from (raw or rollup), which (if any) runtime consolidation was applied (using which processing function), etc. This is very useful information for anyone trying to understand how their data was generated and why it may not look as expected.
To see the metadata response from Metrictank you can inspect the response using the Query Inspector found in the panel queries tab.
Grafana 6.5 includes a new Panel Inspector in alpha/preview where you also can see the metadata response from Metrictank.
You can try it out by enabling a feature flag in the Grafana configuration file:
[feature_toggles]
enable = inspect
In Grafana 6.6, this will have a more user friendly display. In the future, additional Metrictank functionality will become available when the Graphite datasource option is set to the Metrictank type.
Explore/Metrics: Graph hover/tooltip
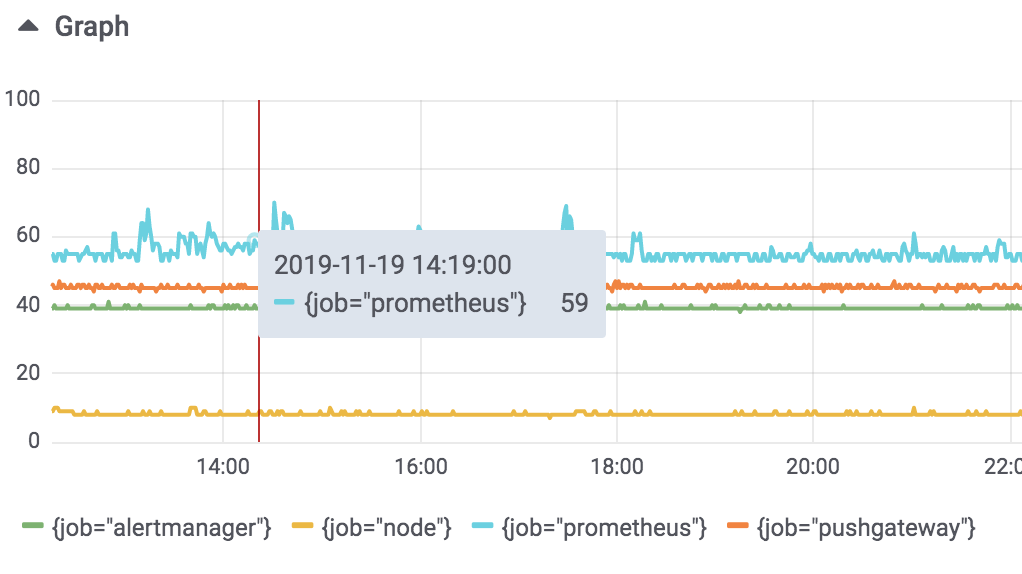
We finally got around to implementing the series hover that shows values of the timeseries you hover over. This has been a requested feature ever since Explore was released. The graph component has been rewritten from scratch, making it more composable for future interactions with the graph data.

Explore/Logs: Log row details
We have massively simplified the way we display both log row labels/fields as well as parsed fields by putting them into an extendable area in each row.
So far labels had been squashed into their own column, making long label values difficult to read or interact with. Similarly, the parsed fields (available for logfmt and JSON structured logs) were too fiddly for mouse interaction. To solve this we took both and put them into a collapsed area below each row for more robust interaction. We have also added the ability to filter out labels, i.e., turn them into a negative filter on click (in addition to a positive filter).

Loki/Explore: Derived fields
Derived fields allow any part of a log message to be turned into a link. Leaning on the concept of data links for graphs, we’ve extended the log result viewer in Explore to turn certain parsed fields into a link, based on a pattern to match.
This allows you to turn an occurrence of e.g., traceId=624f706351956b81 in your log line, into a link to your distributed tracing system to view that trace. The configuration for the patterns to match can be found in the datasource settings.
This release starts with support for Loki, but we will bring this concept to other data sources soon.
Time-sync of split views in Explore
In the Explore split view, you can now link the two timepickers so that if you change one, the other gets changed as well. This helps with keeping start and end times of the split view queries in sync and will ensure that you’re looking at the same time interval in both split panes.

Alerting support for Azure Application Insights
The Azure Monitor data source supports multiple services in the Azure cloud. Before Grafana v6.5, only the Azure Monitor service had support for Grafana Alerting. In Grafana 6.5, alerting support has been implemented for the Application Insights service.
Allow saving of provisioned dashboards from UI
Historically it has been possible to make changes to a provisioned dashboard in the Grafana UI. However, it hasn’t been possible to save the changes without manual intervention. In Grafana 6.5 we introduce a new dashboard provisioning setting named allowUiUpdates. If allowUiUpdates is set to true and you make changes to a provisioned dashboard, you can save the dashboard and the changes will be persisted to the Grafana database.
Read more about this new feature in Provisioning Grafana.
Mix auth proxy with Grafana login token and session cookie
With the new setting, enable_login_token, set to true Grafana will, after successful auth proxy header validation, assign the user a login token and cookie. You only have to configure your auth proxy to provide headers for the /login route. Requests via other routes will be authenticated using the cookie.
Read more about this new feature in Auth Proxy Authentication
Generic OAuth role mapping
Grafana 6.5 makes it possible to configure Generic OAuth to map a certain response from OAuth provider to a certain Grafana organization role, similar to the existing LDAP Group Mappings feature. The new setting is named role_attribute_path and expects a JMESPath expression.
Read more about this new feature in Generic OAuth Authentication and make sure to check out the JMESPath examples.
Image renderer plugin
Since we announced the deprecation of PhantomJS and the new Image Renderer Plugin in Grafana 6.4, we’ve received bug reports and valuable feedback.
In Grafana 6.5 we’ve updated documentation to make it easier to understand how to install and troubleshoot possible problems. Read more about Image Rendering.
Please try the Image Renderer plugin and let us know what you think.
Upgrading
See upgrade notes.
Changelog
Check out CHANGELOG.md for a complete list of new features, changes, and bug fixes.


