
Important: This documentation is about an older version. It's relevant only to the release noted, many of the features and functions have been updated or replaced. Please view the current version.
Visualization panels
Grafana offers a variety of visualizations to support different use cases. This section of the documentation highlights the built-in panels, their options and typical usage.
- Graphs & charts
- Time series is the default and main Graph visualization.
- State timeline for state changes over time.
- Status history for periodic state over time.
- Bar chart shows any categorical data.
- Histogram calculates and shows value distribution in a bar chart.
- Heatmap.
- Pie chart.
- Stats & numbers
- Misc
- Table is the main and only table visualization.
- Logs is the main visualization for logs.
- Node Graph for directed graphs or networks.
- Widgets
- Dashboard list can list dashboards.
- Alert list can list alerts.
- Text panel can show markdown and html.
- News panel can show RSS feeds.
Get more
You can add more visualization types by installing panel panel plugins.
Examples
Below you can find some good examples for how all the visualizations in Grafana can be configured. You can also explore play.grafana.org which has a large set of demo dashboards that showcase all the different visualizations.
Graphs
For time based line, area and bar charts we recommend the default Time series visualization. This public demo dashboard contains many different examples for how this visualization can be configured and styled.

For categorical data use the Bar chart visualization.

Big numbers & stats
The Stat visualization shows one large stat value with an optional graph sparkline. You can control the background or value color using thresholds or color scales.

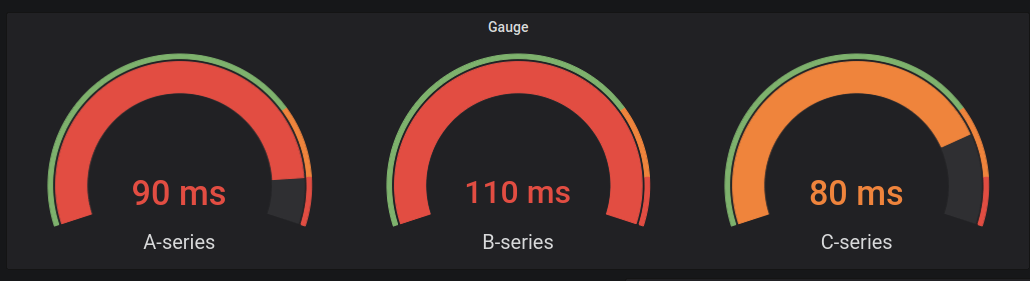
Gauge
If you want to present a value as it relates to a min and max value you have two options. First a standard Radial Gauge shown below.
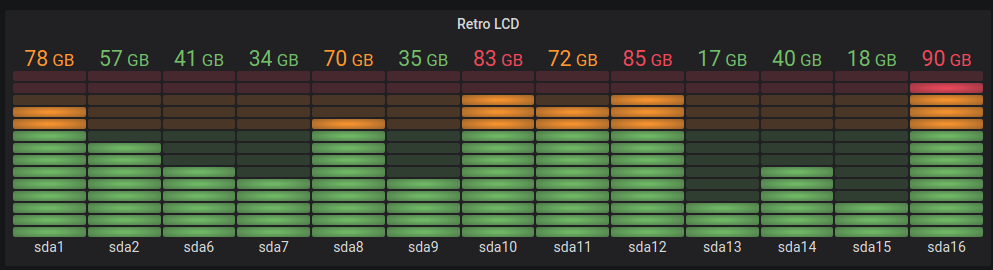
Secondly Grafana also has a horizontal or vertical Bar gauge with three different distinct display modes.
Table
To show data in a table layout, use the Table visualization.

Pie chart
Grafana now ships with an included Pie chart visualization.

Heatmaps
To show value distribution over, time use the heatmap visualization.

State timeline
The state timeline panel visualization shows discrete state changes over time. When used with time series, the thresholds are used to turn the numerical values into discrete state regions.

Was this page helpful?
Related resources from Grafana Labs


