Important: This documentation is about an older version. It's relevant only to the release noted, many of the features and functions have been updated or replaced. Please view the current version.
What’s new in Grafana v7.5
This topic includes the release notes for Grafana v7.5. For all details, read the full CHANGELOG.md.
Grafana OSS features
These features are included in the Grafana open source edition.
Pie chart panel visualization (beta)
Grafana 7.5 adds a beta version of the next-generation pie chart panel.
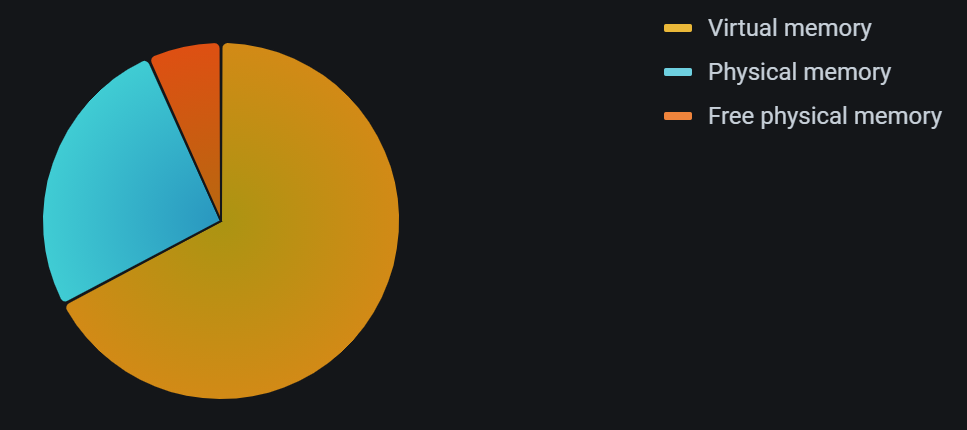
For more information, refer to Pie chart panel.
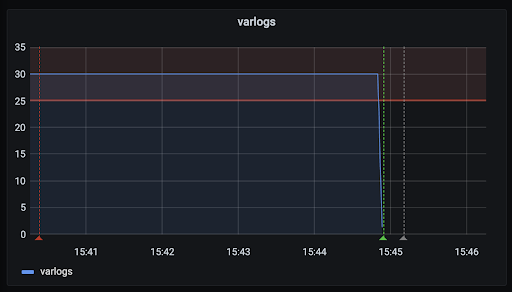
Alerting for Loki
Grafana 7.5 comes with alerting support for Loki. With LogQL you can wrap a log query with the functions that allow for creating metrics out of the logs, such as “rate()”. Metric queries can then be used to calculate things such as the rate of error messages. When combined with log parsers, they can be used to calculate metrics from a value within the log line, such latency or request size.
With alerting support for Loki, you can now create alerts on Loki metrics queries.
Alerting was updated as a result of this change.
Loki label browser
A new Loki logs browser lets you construct the queries step by step: you choose labels that you like to consider, such as “job”, then you select the values that you like, such as “my-app1”. Note that you can select values from more than one label, and that they get facetted. This means only possible label combinations are selectable. When you’re done, you can run the query either as a logs or a metrics query (a metrics query returns the log volume in a chart).
Changed default HTTP method for new Prometheus data sources
For new Prometheus data sources, we have changed the default HTTP method to POST. POST allows for much larger query bodies than using the GET method. This is necessary when sending queries from graphs with a lot of targets, for example, many hosts in a dashboard variable. The POST method also makes the Query Inspector data easier to read since the query is in plain text whereas the GET query is URL encoded.
Note: This is not going to affect provisioned data sources or already created data sources.
Prometheus data source was updated as a result of this change.
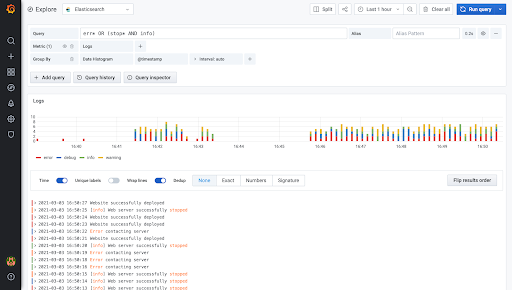
Word highlighting for Elasticsearch
When searching for text in Elasticsearch logs, matching words in the log line returned by the query are now highlighted.
Better format definition for trace data
In Grafana 7.5, we changed how data for the trace view is sent from the data source. The required data frame has a clear format, which is more aligned with how data is generally represented in Grafana. This makes it easier for third-party developers to implement data sources leveraging the trace view.
For more information, refer to trace data API docs.
Paste in SSL certs for Postgres data source
Previously, when users wanted to configure the Postgres data source to connect with SSL certification, they needed to put the certification on the server, and configure the data source with file path.
Instead of the file path, users can now paste the SSL certification content in the UI. This allows them to configure the certification even when they do not have access to the server.
Note: It remains as limitation for the hosted Grafana, because the user doesn’t have access to the server configuration.
Postgres data source and Provisioning were updated as a result of this change.
Deprecation notice for some Azure Monitor queries
In the upcoming Grafana 8.0 release, Application Insights and Insights Analytics query types within the Azure Monitor data source will be deprecated and be made read-only in favor of querying Application Insights from Metrics and Logs.
Grafana 7.5 includes a deprecation notice for these queries, and some documentation to help users prepare for the upcoming changes.
For more information, refer to Deprecating Application Insights and Insights Analytics.
Cloudwatch data source enhancements
Support for region eu-south-1 has been added to the CloudWatch data source. New metrics have also been added to the namespaces AWS/Timestream, AWS/RDS (RDS Proxy metrics), AWS/NetworkFirewall, AWS/GroundStation, and AWS/DDoSProtection. Many thanks to relvira, ilyastoli, and rubycut for contributing!
Added a page limit to the List Metrics API call to improve speed and reduce memory consumption. You can change this limit by entering a higher value in list_metrics_page_limit in the Grafana configuration file.
You can now enable or disable authentication providers and assume a role other than default by changing the allowed_auth_providers and assume_role_enabled options in the Grafana configuration file. By default, the allowed authentication providers are AWS SDK Default, Access && secret key, and Credentials File, and role is Assume role (ARN).
You can now specify a custom endpoint in the CloudWatch data source configuration page. This field is optional, and if it is left empty, then the default endpoint for CloudWatch is used. By specifying a regional endpoint, you can reduce request latency.
AWS Cloudwatch data source was updated as a result of this change.
Increased API limit for CloudMonitoring Services
In previous versions, when querying metrics for Service Level Objectives (SLOs) in the CloudMonitoring data source, only the first 100 services were listed in the Service field list. To overcome this issue, the API limit for listing services has been increased to 1000.
Tempo as a backend data source
We have converted Tempo to a backend data source and dropped support for tempo-query’s (Jaeger) response. To configure it, you can now point to the port that is set in the Tempo configuration file.
server:
  http_listen_port: 3101
Azure Monitor data source was updated as a result of this change.
Enterprise features
These features are included in the Grafana Enterprise edition.
Query caching
When caching is enabled, Grafana temporarily stores the results of data source queries. When you or another user submit the same query again, the results return from the cache instead of from the data source (such as Splunk or ServiceNow).
Query caching advantages:
- Faster dashboard load times, especially for popular dashboards.
- Reduced API costs.
- Reduced likelihood that APIs will rate-limit or throttle requests.
Caching currently works for all backend data sources. You can enable the cache globally or per data source, and you can configure the cache duration per data source. The cache is currently in-memory.
For more information, refer to Query caching.
Use template variable in reports
If you have created dashboards with template variables, then you can choose which values are selected when rendering a report. This makes it easier to tailor reports to their audience or generate multiple reports from the same dashboard.
Enable this feature in configuration settings using the templateVariables flag.
For more information, refer to Reporting.
Active user limits
If a Grafana instance has exceeded its licensed number of active users, then non-active users who try to sign in to Grafana will be prevented from doing so. Active users are users who have logged in to Grafana in the past 30 days. The total number of users registered in Grafana does not affect this rule. This enforcement is applied separately for Viewers and for Editor/Admins, so if you reach your active Viewer limit, new Editor/Admins will still be able to sign in. This rule also includes a 10% buffer, meaning that you need to exceed your limit by 10% before users are prevented from signing in.
Here is an example:
A Grafana Enterprise instance includes 100 Viewers and 50 Editor/Admins. Over the course of the last 30 days, 110 Viewers and 20 Editor/Admins have signed in to Grafana.
All of the Viewers who have signed in over the past 30 days will retain the ability to sign in.
When a previously-inactive Viewer (someone who has not signed in over the past 30 days) tries to sign in, they will see a message and be prevented from signing in until the number of active users dips back below 110. New Editor/Admins are not affected by this; they can continue to sign in until the number of active Editors/Admins reaches 55.
If you try to sign in to a fourth device or browser, then you will be prevented from doing so; the limit of concurrent sessions is three.
If you sign in to a fourth device or browser, then you will be signed out of the session that is least current. Concurrent session limits Each Grafana Enterprise user will be limited to three concurrent user sessions. When a user opens a fourth session, then the longest-inactive session will be automatically signed out.
A new session is created when you sign in to Grafana from a different device or a different browser. Multiple windows and tabs in the same browser are all part of the same session, so having many Grafana tabs open will not cause any issues.
For more information on Grafana Enterprise licensing and restrictions, refer to License restrictions.
Breaking changes
There are no known breaking changes in this release.
Updated configuration
[server]
read_timeout = 0
Sets the maximum time using a duration format (5s/5m/5ms) before timing out read of an incoming request and closing idle connections.
0 means there is no timeout for reading the request.


