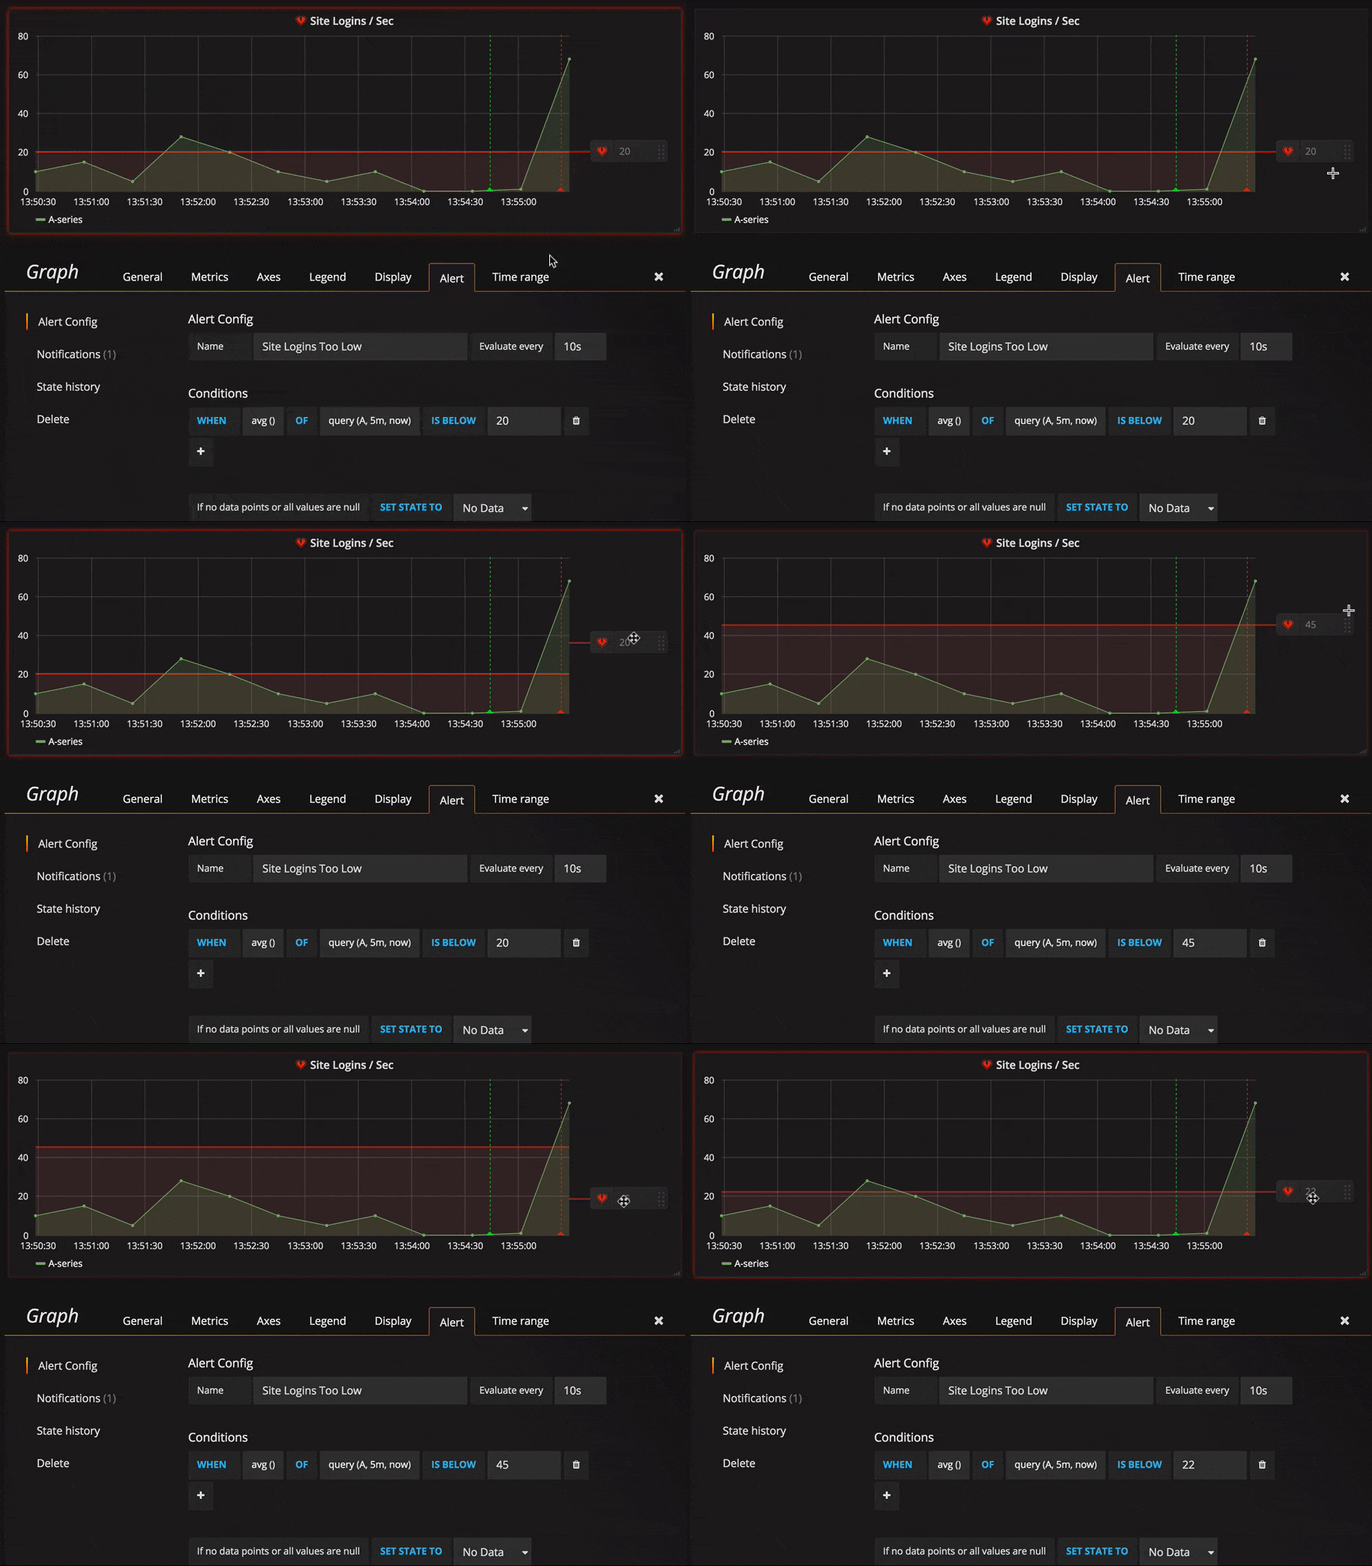
Important: This documentation is about an older version. It's relevant only to the release noted, many of the features and functions have been updated or replaced. Please view the current version.
Create alerts
Grafana alerting allows you to attach rules to your dashboard panels. When you save the dashboard, Grafana extracts the alert rules into a separate alert rule storage and schedules them for evaluation.

In the Alert tab of the graph panel you can configure how often the alert rule should be evaluated and the conditions that need to be met for the alert to change state and trigger its notifications.
Currently only the graph panel supports alert rules.
Add or edit an alert rule
- Navigate to the panel you want to add or edit an alert rule for, click the title, and then click Edit.
- On the Alert tab, click Create Alert. If an alert already exists for this panel, then you can just edit the fields on the Alert tab.
- Fill out the fields. Descriptions are listed below in Alert rule fields.
- When you have finished writing your rule, click Save in the upper right corner to save alert rule and the dashboard.
- (Optional but recommended) Click Test rule to make sure the rule returns the results you expect.
Delete an alert
To delete an alert, scroll to the bottom of the alert and then click Delete.
Alert rule fields
This section describes the fields you fill out to create an alert.
Rule
- Name - Enter a descriptive name. The name will be displayed in the Alert Rules list. This field supports templating.
- Evaluate every - Specify how often the scheduler should evaluate the alert rule. This is referred to as the evaluation interval.
- For - Specify how long the query needs to violate the configured thresholds before the alert notification triggers.
You can set a minimum evaluation interval in the alerting.min_interval_seconds configuration field, to set a minimum time between evaluations. Refer to Configuration for more information.
Caution: Do not use
Forwith theIf no data or all values are nullsetting set toNo Data. The triggering ofNo Datawill trigger instantly and not takeForinto consideration. This may also result in that an OK notification not being sent if alert transitions fromNo Data -> Pending -> OK.
If an alert rule has a configured For and the query violates the configured threshold, then it will first go from OK to Pending. Going from OK to Pending Grafana will not send any notifications. Once the alert rule has been firing for more than For duration, it will change to Alerting and send alert notifications.
Typically, it’s always a good idea to use this setting since it’s often worse to get false positive than wait a few minutes before the alert notification triggers. Looking at the Alert list or Alert list panels you will be able to see alerts in pending state.
Below you can see an example timeline of an alert using the For setting. At ~16:04 the alert state changes to Pending and after 4 minutes it changes to Alerting which is when alert notifications are sent. Once the series falls back to normal the alert rule goes back to OK.

Conditions
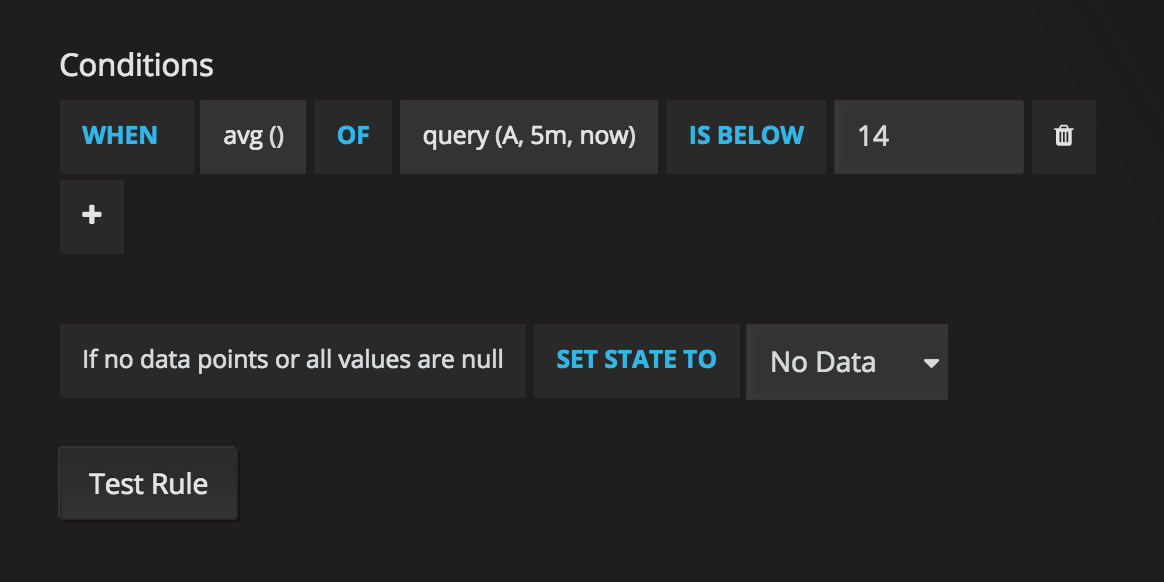
Currently the only condition type that exists is a Query condition that allows you to
specify a query letter, time range and an aggregation function.
Query condition example
avg() OF query(A, 15m, now) IS BELOW 14avg()Controls how the values for each series should be reduced to a value that can be compared against the threshold. Click on the function to change it to another aggregation function.query(A, 15m, now)The letter defines what query to execute from the Metrics tab. The second two parameters define the time range,15m, nowmeans 15 minutes ago to now. You can also do10m, now-2mto define a time range that will be 10 minutes ago to 2 minutes ago. This is useful if you want to ignore the last 2 minutes of data.IS BELOW 14Defines the type of threshold and the threshold value. You can click onIS BELOWto change the type of threshold.
The query used in an alert rule cannot contain any template variables. Currently we only support AND and OR operators between conditions and they are executed serially.
For example, we have 3 conditions in the following order:
condition:A(evaluates to: TRUE) OR condition:B(evaluates to: FALSE) AND condition:C(evaluates to: TRUE)
so the result will be calculated as ((TRUE OR FALSE) AND TRUE) = TRUE.
We plan to add other condition types in the future, like Other Alert, where you can include the state of another alert in your conditions, and Time Of Day.
Multiple Series
If a query returns multiple series, then the aggregation function and threshold check will be evaluated for each series. What Grafana does not do currently is track alert rule state per series. This has implications that are detailed in the scenario below.
- Alert condition with query that returns 2 series: server1 and server2
- server1 series causes the alert rule to fire and switch to state
Alerting - Notifications are sent out with message: load peaking (server1)
- In a subsequent evaluation of the same alert rule, the server2 series also causes the alert rule to fire
- No new notifications are sent as the alert rule is already in state
Alerting.
So, as you can see from the above scenario Grafana will not send out notifications when other series cause the alert to fire if the rule already is in state Alerting. To improve support for queries that return multiple series we plan to track state per series in a future release.
Starting with Grafana v5.3 you can configure reminders to be sent for triggered alerts. This will send additional notifications when an alert continues to fire. If other series (like server2 in the example above) also cause the alert rule to fire they will be included in the reminder notification. Depending on what notification channel you’re using you may be able to take advantage of this feature for identifying new/existing series causing alert to fire.
No Data & Error Handling
Below are conditions you can configure how the rule evaluation engine should handle queries that return no data or only null values.
| No Data Option | Description |
|---|---|
| No Data | Set alert rule state to NoData |
| Alerting | Set alert rule state to Alerting |
| Keep Last State | Keep the current alert rule state, whatever it is. |
| Ok | Not sure why you would want to send yourself an alert when things are okay, but you could. |
Execution errors or timeouts
Tell Grafana how to handle execution or timeout errors.
| Error or timeout option | Description |
|---|---|
| Alerting | Set alert rule state to Alerting |
| Keep Last State | Keep the current alert rule state, whatever it is. |
If you have an unreliable time series store from which queries sometime timeout or fail randomly you can set this option to Keep Last State in order to basically ignore them.
Notifications
In alert tab you can also specify alert rule notifications along with a detailed message about the alert rule. The message can contain anything, information about how you might solve the issue, link to runbook, and so on.
The actual notifications are configured and shared between multiple alerts. Read Alert notifications for information on how to configure and set up notifications.
- Send to - Select an alert notification channel if you have one set up.
- Message - Enter a text message to be sent on the notification channel. Some alert notifiers support transforming the text to HTML or other rich formats. This field supports templating.
- Tags - Specify a list of tags (key/value) to be included in the notification. It is only supported by some notifiers.
Alert state history and annotations
Alert state changes are recorded in the internal annotation table in Grafana’s database. The state changes are visualized as annotations in the alert rule’s graph panel. You can also go into the State history submenu in the alert tab to view and clear state history.


