
Important: This documentation is about an older version. It's relevant only to the release noted, many of the features and functions have been updated or replaced. Please view the current version.
Table panel
The table panel is very flexible, supporting multiple modes for time series and for tables, annotation, and raw JSON data. This panel also provides date formatting, value formatting, and coloring options.

Data and field options
Table visualizations allow you to apply:
Display options
Note: If you are using a table visualization created before Grafana 7.0, then you need to migrate to the new table version in order to see these options. To migrate, on the Panel tab, click Table visualization. Grafana updates the table version and you can then access all table options.
Show header - Show or hide column names imported from your data source.
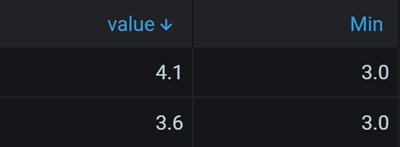
Sort ascending/descending - Click a column title to change the sort order from default to descending to ascending. Each time you click, the sort order changes to the next option in the cycle. You can only sort by one column at a time.
![Sort descending]()
Table field options allow you to change field options such as column width, alignment, and cell display mode.
Filter table columns - You can temporarily change how column data is displayed. For example, you can order values from highest to lowest or hide specific values.
Annotation support
Annotations are not currently supported in the new table panel. This might be added back in a future release.
Was this page helpful?
Related resources from Grafana Labs


