
Important: This documentation is about an older version. It's relevant only to the release noted, many of the features and functions have been updated or replaced. Please view the current version.
Templates and variables
A variable is a placeholder for a value. You can use variables in metric queries and in panel titles. So when you change the value, using the dropdown at the top of the dashboard, your panel’s metric queries will change to reflect the new value.
Variables allow you to create more interactive and dynamic dashboards. Instead of hard-coding things like server, application, and sensor names in your metric queries, you can use variables in their place. Variables are displayed as dropdown lists at the top of the dashboard. These dropdowns make it easy to change the data being displayed in your dashboard.
These can be especially useful for administrators who want to allow Grafana viewers to quickly adjust visualizations but do not want to give them full editing permissions. Grafana Viewers can use variables.
Variables and templates also allow you to single-source dashboards. If you have multiple identical data sources or servers, you can make one dashboard and use variables to change what you are viewing. This simplifies maintenance and upkeep enormously.
Templates
A template is any query that contains a variable.
For example, if you were administering a dashboard to monitor several servers, you could make a dashboard for each server. Or you could create one dashboard and use panels with template queries like this one:
wmi_system_threads{instance=~"$server"}Variable values are always synced to the URL using the syntax var-<varname>=value.
Variable syntax
Panel titles and metric queries can refer to variables using two different syntaxes:
$varnameThis syntax is easy to read, but it does not allow you to use a variable in the middle of a word. Example: apps.frontend.$server.requests.count[[varname]]Note: This syntax might be deprecated in the future. Example: apps.frontend.[[server]].requests.count
Before queries are sent to your data source the query is interpolated, meaning the variable is replaced with its current value. During interpolation, the variable value might be escaped in order to conform to the syntax of the query language and where it is used. For example, a variable used in a regex expression in an InfluxDB or Prometheus query will be regex escaped. Read the data source specific documentation topic for details on value escaping during interpolation.
For advanced syntax to override data source default formatting, refer to Advanced variable format options.
Examples of templates and variables
To see variable and template examples, go to any of the dashboards listed below.
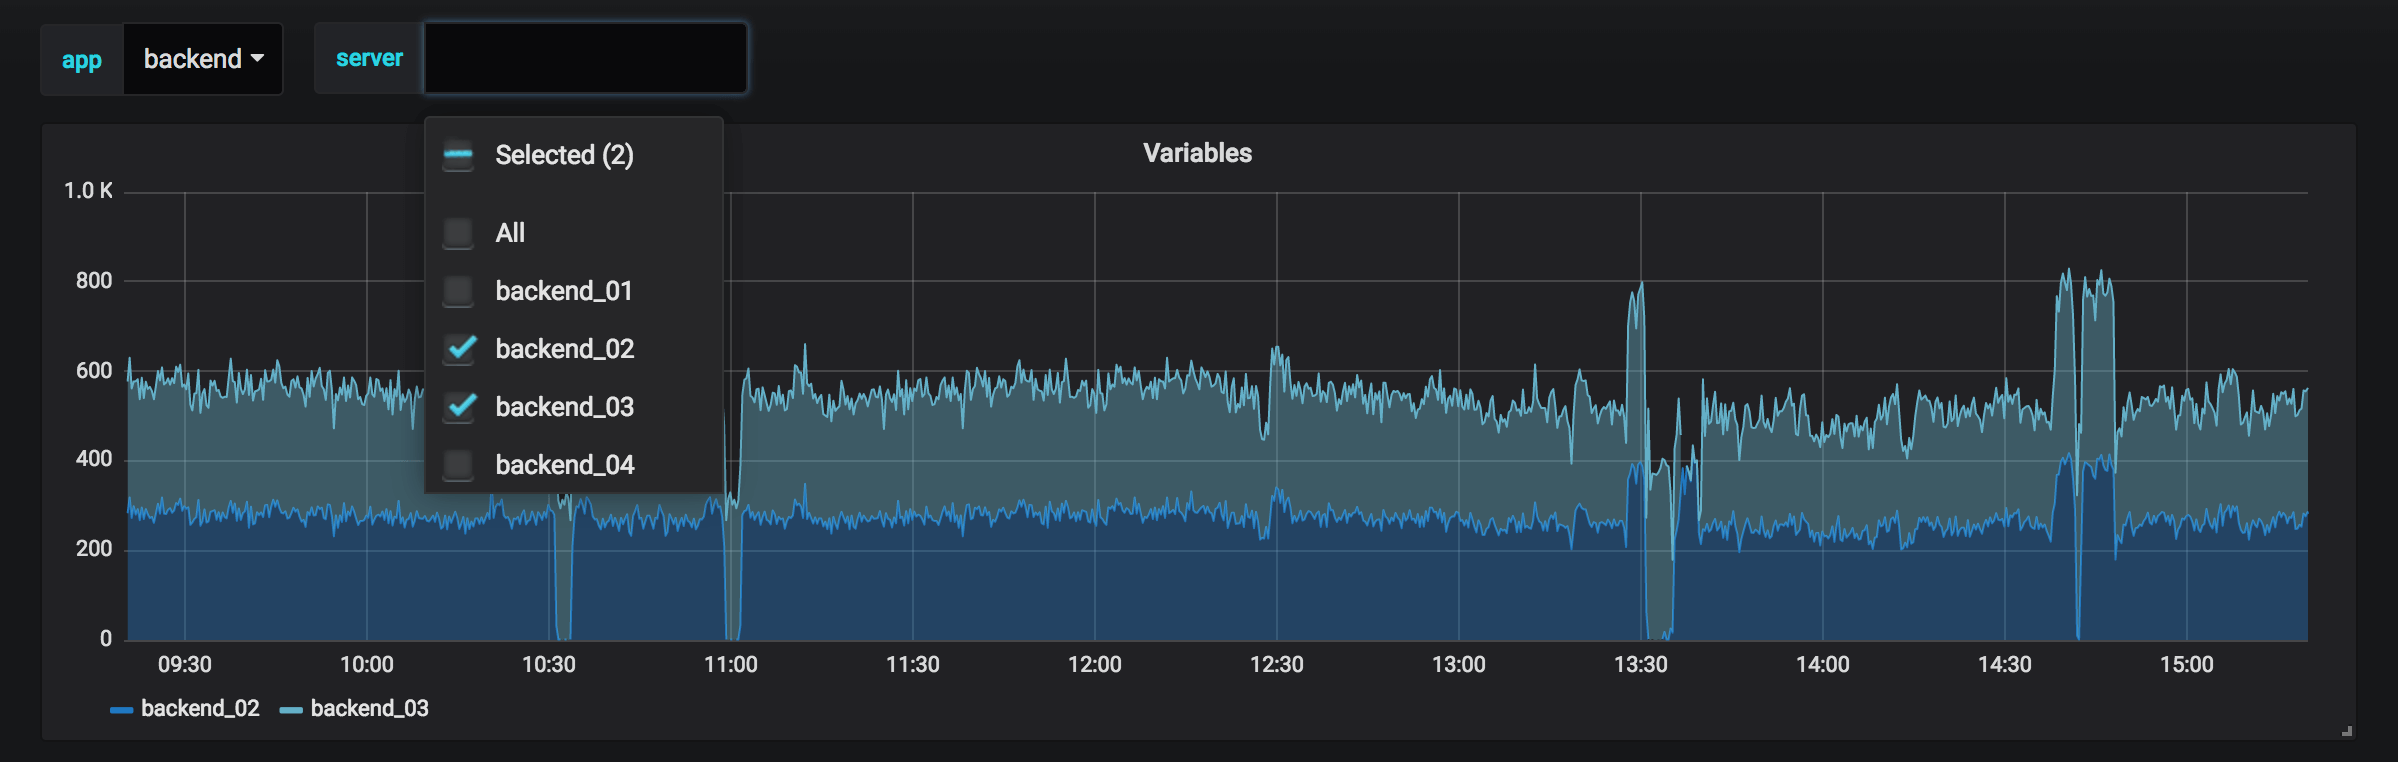
Variables are listed in dropdown lists across the top of the screen. Select different variables to see how the visualizations change.
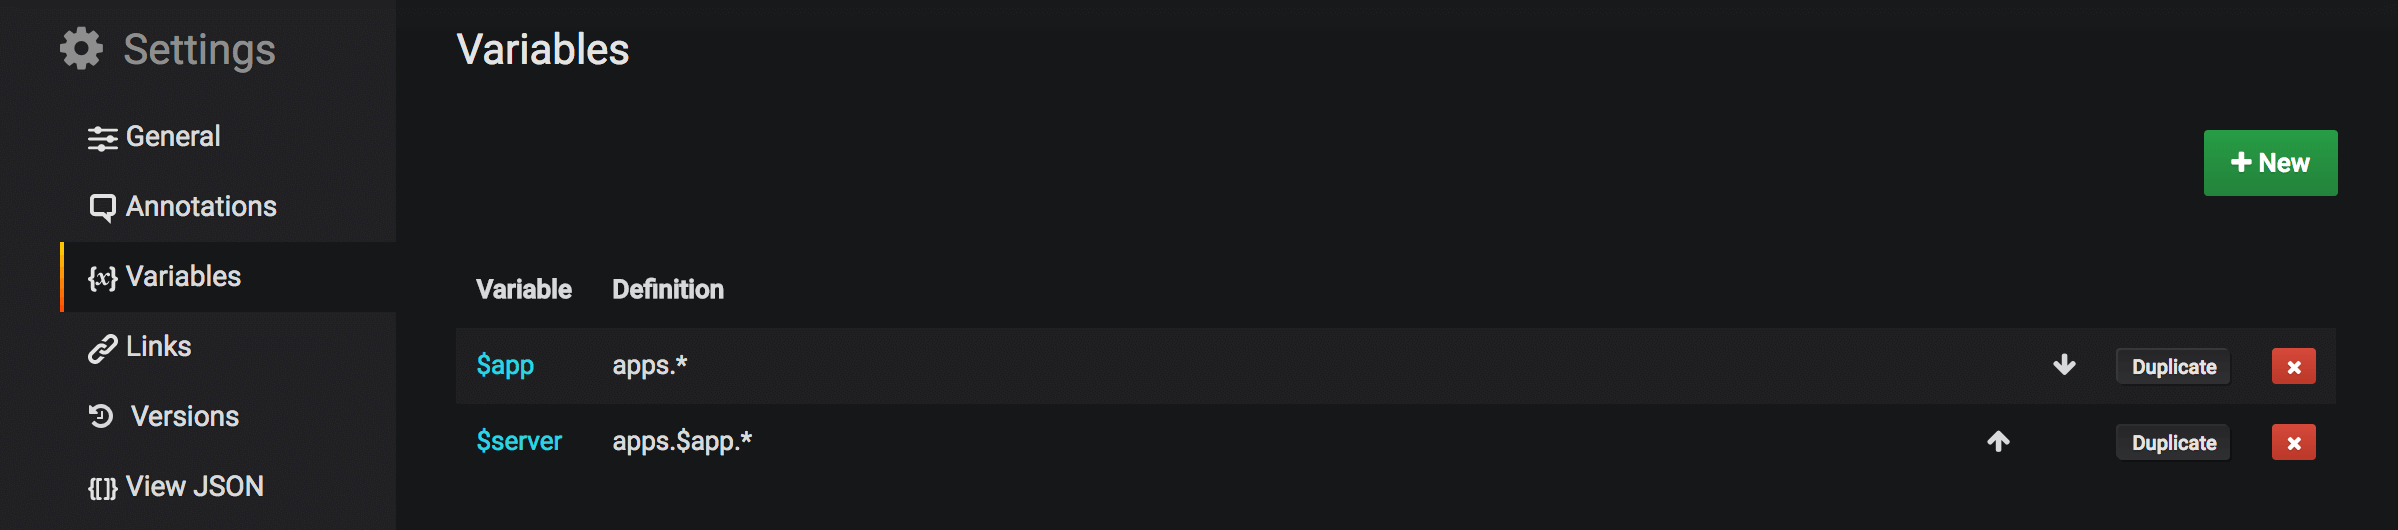
To see variable settings, navigate to Dashboard Settings > Variables. Click a variable in the list to see its settings.
Variables can be used in titles, descriptions, text panels, and queries. Queries with text that starts with $ are templates. Not all panels will have template queries.
Variable types
Grafana also has global built-in variables that can be used in expressions in the query editor. Refer to Global variables for more information.
You can also define the following types of variables in Grafana.
| Type | Description |
|---|---|
| Query | This variable type allows you to write a data source query that usually returns a list of metric names, tag values or keys. For example, a query that returns a list of server names, sensor ids or data centers. |
| Interval | This variable can represent time spans. Instead of hard-coding a group by time or date histogram interval, use a variable of this type. |
| Data source | This type allows you to quickly change the data source for an entire Dashboard. Useful if you have multiple instances of a data source in for example different environments. |
| Custom | Define the variable options manually using a comma separated list. |
| Constant | Define a hidden constant. Useful for metric path prefixes for dashboards you want to share. During dashboard export, constant variables will be made into an import option. |
| Ad hoc filters | Very special kind of variable that only works with some data sources, InfluxDB, Prometheus, and Elasticsearch currently. It allows you to add key/value filters that will automatically be added to all metric queries that use the specified data source. |
| Text box | This variable type will display as a free text input field with an optional default value. |
Adding a variable
You add variables via Dashboard cogs menu > Templating. This opens up a list of variables and a New button to create a new variable.
Basic variable options
| Option | Description |
|---|---|
| Name | The name of the variable, this is the name you use when you refer to your variable in your metric queries. Must be unique and contain no white-spaces. |
| Label | The name of the dropdown for this variable. |
| Hide | Options to hide the dropdown select box. |
| Type | Defines the variable type. |
Query options
This variable type is the most powerful and complex as it can dynamically fetch its options using a data source query.
| Option | Description |
|---|---|
| Data source | The data source target for the query. |
| Refresh | Controls when to update the variable option list (values in the dropdown). On Dashboard Load will slow down dashboard load as the variable query needs to be completed before dashboard can be initialized. Set this only to On Time Range Change if your variable options query contains a time range filter or is dependent on dashboard time range. |
| Query | The data source specific query expression. |
| Regex | Regex to filter or capture specific parts of the names return by your data source query. Optional. |
| Sort | Define sort order for options in dropdown. Disabled means that the order of options returned by your data source query will be used. |
Using regex to filter/modify values in the Variable dropdown
Using the Regex Query Option, you filter the list of options returned by the Variable query or modify the options returned.
Examples of filtering on the following list of options:
backend_01
backend_02
backend_03
backend_04
Filter so that only the options that end with 01 or 02 are returned:
Regex:
/.*[01|02]/Result:
backend_01
backend_02
Filter and modify the options using a regex capture group to return part of the text:
Regex:
/.*(01|02)/Result:
01
02
Filter and modify - Prometheus Example
List of options:
up{instance="demo.robustperception.io:9090",job="prometheus"} 1 1521630638000
up{instance="demo.robustperception.io:9093",job="alertmanager"} 1 1521630638000
up{instance="demo.robustperception.io:9100",job="node"} 1 1521630638000
Regex:
/.*instance="([^"]*).*/Result:
demo.robustperception.io:9090
demo.robustperception.io:9093
demo.robustperception.io:9100
Query expressions
The query expressions are different for each data source.
- Graphite templating queries
- Elasticsearch templating queries
- InfluxDB templating queries
- Prometheus templating queries
- OpenTSDB templating queries
- AzureMonitor templating queries
One thing to note is that query expressions can contain references to other variables and in effect create linked variables. Grafana will detect this and automatically refresh a variable when one of it’s containing variables change.
Selection options
| Option | Description |
|---|---|
| Multi-value | If enabled, the variable will support the selection of multiple options at the same time. |
| Include All option | Add a special All option whose value includes all options. |
| Custom all value | By default the All value will include all options in combined expression. This can become very long and can have performance problems. Many times it can be better to specify a custom all value, like a wildcard regex. To make it possible to have custom regex, globs or lucene syntax in the Custom all value option it is never escaped so you will have to think about what is a valid value for your data source. |
Formatting multiple values
Interpolating a variable with multiple values selected is tricky as it is not straight forward how to format the multiple values into a string that is valid in the given context where the variable is used. Grafana tries to solve this by allowing each data source plugin to inform the templating interpolation engine what format to use for multiple values.
Note that the Custom all value option on the variable will have to be left blank for Grafana to format all values into a single string.
Graphite, for example, uses glob expressions. A variable with multiple values would, in this case, be interpolated as {host1,host2,host3} if
the current variable value was host1, host2 and host3.
InfluxDB and Prometheus uses regex expressions, so the same variable
would be interpolated as (host1|host2|host3). Every value would also be regex escaped if not, a value with a regex control character would
break the regex expression.
Elasticsearch uses lucene query syntax, so the same variable would, in this case, be formatted as ("host1" OR "host2" OR "host3"). In this case every value
needs to be escaped so that the value can contain lucene control words and quotation marks.
Formatting troubles
Automatic escaping and formatting can cause problems and it can be tricky to grasp the logic is behind it. Especially for InfluxDB and Prometheus where the use of regex syntax requires that the variable is used in regex operator context. If you do not want Grafana to do this automatic regex escaping and formatting your only option is to disable the Multi-value or Include All option options.
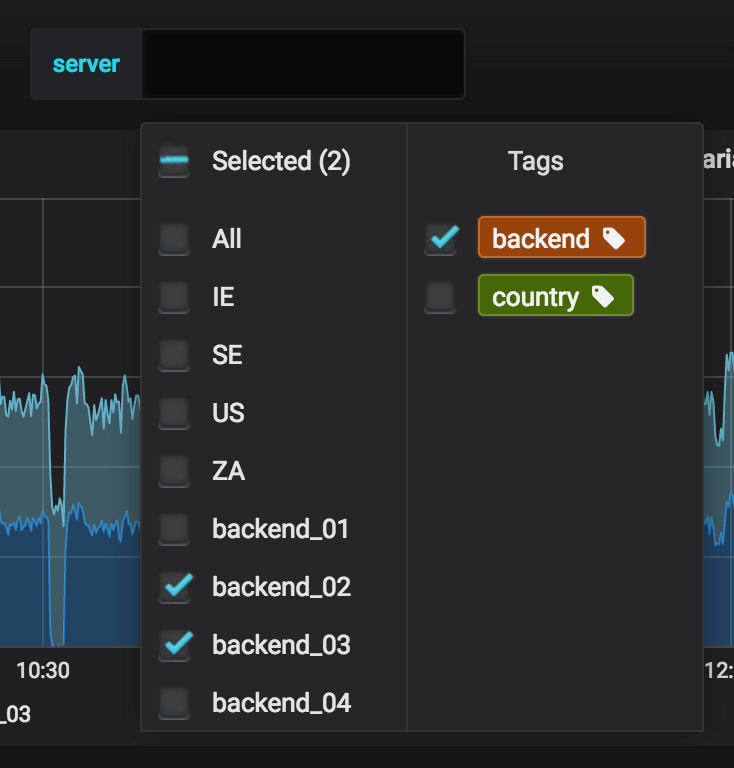
Value groups/tags
If you have a lot of options in the dropdown for a multi-value variable. You can use this feature to group the values into selectable tags.
| Option | Description |
|---|---|
| Tags query | Data source query that should return a list of tags |
| Tag values query | Data source query that should return a list of values for a specified tag key. Use $tag in the query to refer the currently selected tag. |
Interval variables
Use the Interval type to create a variable that represents a time span (eg. 1m,1h, 1d). There is also a special auto option that will change depending on the current time range. You can specify how many times the current time range should be divided to calculate the current auto timespan.
This variable type is useful as a parameter to group by time (for InfluxDB), Date histogram interval (for Elasticsearch) or as a summarize function parameter (for Graphite).
Example using the template variable myinterval of type Interval in a graphite function:
summarize($myinterval, sum, false)Was this page helpful?
Related resources from Grafana Labs


