
Important: This documentation is about an older version. It's relevant only to the release noted, many of the features and functions have been updated or replaced. Please view the current version.
Using Elasticsearch in Grafana
Grafana ships with advanced support for Elasticsearch. You can do many types of simple or complex elasticsearch queries to visualize logs or metrics stored in elasticsearch. You can also annotate your graphs with log events stored in elasticsearch.
Adding the data source
Open the side menu by clicking the the Grafana icon in the top header.
In the side menu under the
Dashboardslink you should find a link namedData Sources.NOTE: If this link is missing in the side menu it means that your current user does not have the
Adminrole for the current organization.Click the
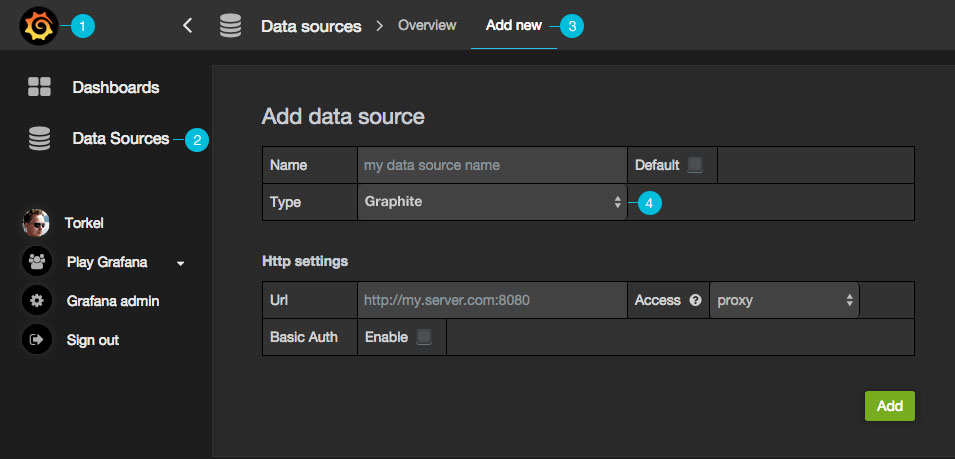
Add newlink in the top header.Select
Elasticsearchfrom the dropdown.
| Name | Description |
|---|---|
| Name | The data source name, important that this is the same as in Grafana v1.x if you plan to import old dashboards. |
| Default | Default data source means that it will be pre-selected for new panels. |
| Url | The http protocol, ip and port of you elasticsearch server. |
| Access | Proxy = access via Grafana backend, Direct = access directly from browser. |
Proxy access means that the Grafana backend will proxy all requests from the browser, and send them on to the Data Source. This is useful because it can eliminate CORS (Cross Origin Site Resource) issues, as well as eliminate the need to disseminate authentication details to the Data Source to the browser.
Direct access is still supported because in some cases it may be useful to access a Data Source directly depending on the use case and topology of Grafana, the user, and the Data Source.
Direct access
If you select direct access you must update your Elasticsearch configuration to allow other domains to access Elasticsearch from the browser. You do this by specifying these to options in your elasticsearch.yml config file.
http.cors.enabled: true
http.cors.allow-origin: "*"
Index settings
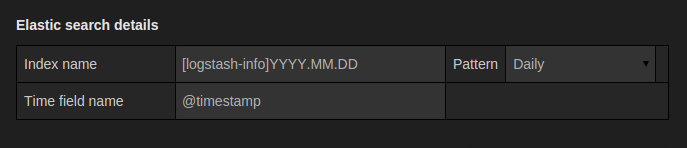
Here you can specify a default for the time field and specify the name of your elasticsearch index. You can use
a time pattern for the index name or a wildcard.
Metric Query editor
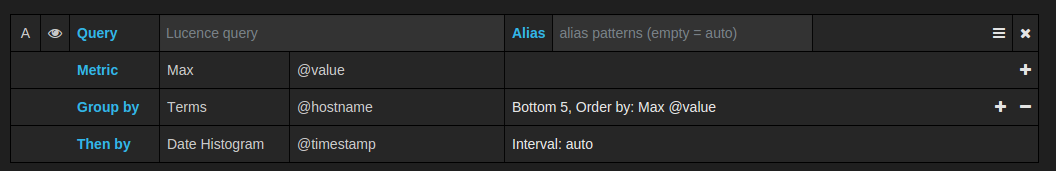
The Elasticsearch query editor allows you to select multiple metrics and group by multiple terms or filters. Use the plus and minus icons to the right to add / remove metrics or group bys. Some metrics and group by have options, click the option text to expand the the row to view and edit metric or group by options.
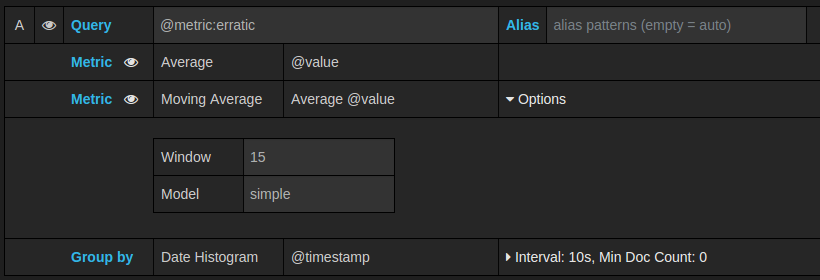
Pipeline metrics
If you have Elasticsearch 2.x and Grafana 2.6 or above then you can use pipeline metric aggregations like Moving Average and Derivative. Elasticsearch pipeline metrics require another metric to be based on. Use the eye icon next to the metric to hide metrics from appearing in the graph. This is useful for metrics you only have in the query to be used in a pipeline metric.
Templating
The Elasticsearch datasource supports two types of queries you can use to fill template variables with values.
Possible values for a field
{"find": "terms", "field": "@hostname"}Fields filtered by type
{"find": "fields", "type": "string"}Fields filtered by type, with filter
{"find": "fields", "type": "string", "query": <lucene query>}Multi format / All format
Use lucene format.
Was this page helpful?
Related resources from Grafana Labs


