
Important: This documentation is about an older version. It's relevant only to the release noted, many of the features and functions have been updated or replaced. Please view the current version.
Configure a Tempo data source
The Tempo data source sets how Grafana connects to your Tempo database and lets you configure features and integrations with other telemetry signals.
You can configure the data source using either the data source interface in Grafana or using a configuration file. This page explains how to set up and enable the data source capabilities using Grafana.
If you’re using your own installation of Grafana, you can provision the Tempo data source using a YAML configuration file.
Depending upon your tracing environment, you may have more than one Tempo instance. Grafana supports multiple Tempo data sources.
Before you begin
To configure a Tempo data source, you need administrator rights to your Grafana instance and a Tempo instance configured to send tracing data to Grafana.
If you’re provisioning a Tempo data source, then you also need administrative rights on the server hosting your Grafana instance. Refer to Provision the data source for next steps.

Add or modify a data source
You can use these procedures to configure a new Tempo data source or to edit an existing one.
Add a new data source
Follow these steps to set up a new Tempo data source:
- Select Connections in the main menu.
- Enter
Tempoin the search bar. - Select Tempo.
- Select Add new data source in the top-right corner of the page.
- On the Settings tab, complete the Name, Connection, and Authentication sections.
- Use the Name field to specify the name used for the data source in panels, queries, and Explore. Toggle the Default switch for the data source to be pre-selected for new panels.
- Under Connection, enter the URL of the Tempo instance, for example,
https://example.com:4100. - Complete the Authentication section.
- Optional: Configure other sections to add capabilities to your tracing data. Refer to the additional procedures for instructions.
- Select Save & test.
Update an existing data source
To modify an existing Tempo data source:
- Select Connections in the main menu.
- Select Data sources to view a list of configured data sources.
- Select the Tempo data source you wish to modify.
- Configure or update additional sections to add capabilities to your tracing data. Refer to the additional procedures for instructions.
- After completing your updates, select Save & test.
Authentication
Use this section to select an authentication method to access the data source.
Note
Use Transport Layer Security (TLS) for an additional layer of security when working with Tempo. For additional information on setting up TLS encryption with Tempo, refer to Configure TLS communication and Tempo configuration.
To set up authentication:
Select an authentication method from the drop-down list:
- Basic authentication: Authenticates your data source using a username and password
- Forward OAuth identity: Forwards the OAuth access token and the OIDC ID token, if available, of the user querying to the data source
- No authentication: No authentication is required to access the data source
For Basic authentication only: Enter the User and Password.
Optional: Complete the TLS settings for additional security methods.
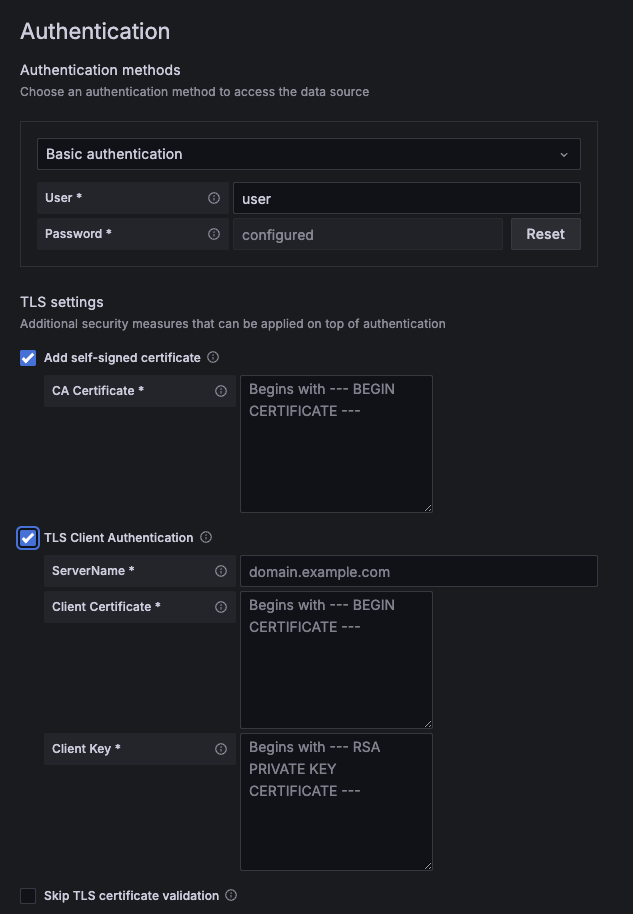
- TLS Client Authentication
- Toggle on to use client authentication. When enabled, it adds the Server name, Client cert, and Client key fields. The client provides a certificate that is validated by the server to establish the client’s trusted identity. The client key encrypts the data between client and server. These details are encrypted and stored in the Grafana database.
- Add self-signed certificate
- Activate this option to use a self-signed TLS certificate. You can add your own Certificate Authority (CA) certificate on top of one generated by the certificate authorities for additional security measure.
- Skip TLS certification validation
- When activated, it bypasses TLS certificate verification. Not recommended, unless absolutely necessary for testing.
![Authentication section showing the TLS client certificate options]()
Optional: Add HTTP Headers. You can pass along additional context and metadata data about the request and response. Select Add header to add Header and Value fields.
Select Save & test to preserve your changes.
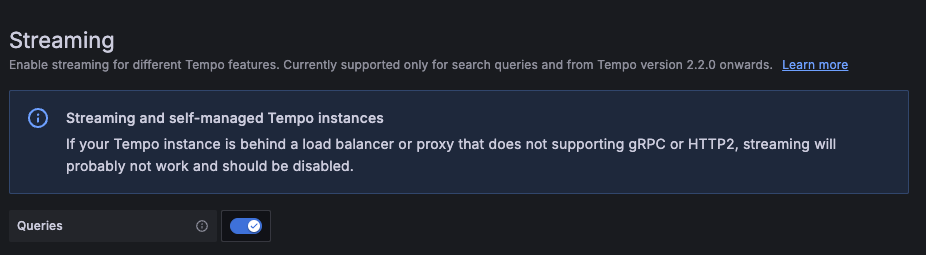
Streaming
Streaming enables TraceQL query results to be displayed as they become available. Without streaming, no results are displayed until all results have returned.
Note
TraceQL streaming results is currently in public preview. Grafana Labs offers limited support, and breaking changes might occur prior to the feature being made generally available.
To use streaming, you need to:
- Run Tempo version 2.2 or newer, or Grafana Enterprise Traces (GET) version 2.2 or newer, or use Grafana Cloud Traces.
- For self-managed Tempo or GET instances: If your Tempo or GET instance is behind a load balancer or proxy that doesn’t supporting gRPC or HTTP2, streaming may not work and should be disabled.
Activate streaming
You can activate streaming by either setting the traceQLStreaming feature toggle to true or by activating the Streaming toggle in the Tempo data source.
If you are using Grafana Cloud, the traceQLStreaming feature toggle is already set to true by default.
If the Tempo data source is set to allow streaming but the traceQLStreaming feature toggle is set to false in Grafana, streaming occurs.
If the data source has streaming disabled and traceQLStreaming is set to true, streaming happens for that data source.
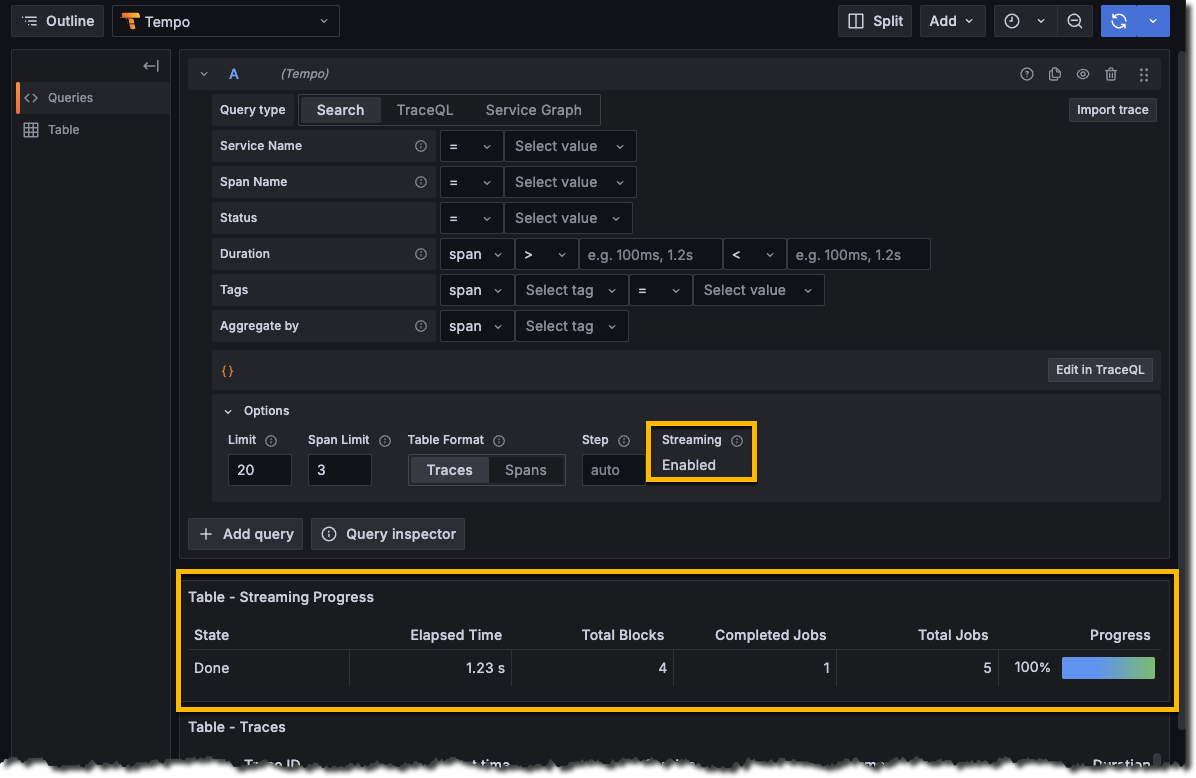
When streaming is active, it’s shows as Enabled in Explore. To check the status, select Explore in the menu, select your Tempo data source, and expand the Options section.
Trace to logs
The Trace to logs setting configures trace to logs that’s available when you integrate Grafana with Tempo. Trace to logs can also be used with other tracing data sources, such as Jaeger and Zipkin.
There are two ways to configure the trace to logs feature:
- Use a simplified configuration with default query, or
- Configure a custom query where you can use a template language to interpolate variables from the trace or span.
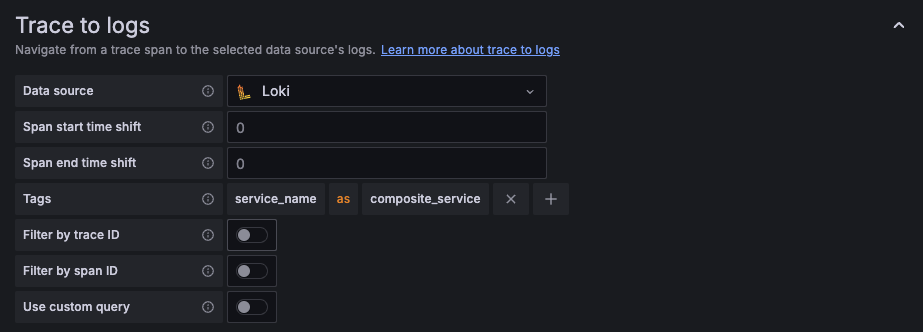
Use a simple configuration
Select the target data source from the drop-down list.
You can also click Open advanced data source picker to see more options, including adding a data source.
Set start and end time shift. As the logs timestamps may not exactly match the timestamps of the spans in trace it may be necessary to search in larger or shifted time range to find the desired logs.
Select which tags to use in the logs query. The tags you configure must be present in the span’s attributes or resources for a trace to logs span link to appear. You can optionally configure a new name for the tag. This is useful, for example, if the tag has dots in the name and the target data source does not allow using dots in labels. In that case, you can for example remap
http.status(the span attribute) tohttp_status(the data source field). “Data source” in this context can refer to Loki, or another log data source.Optional: If your logs consistently trace or span IDs, you can use one or both of the Filter by trace ID and Filter by span ID settings.
Configure a custom query
Select the target data source from the drop-down list.
You can also click Open advanced data source picker to see more options, including adding a data source.
Set start and end time shift. As the logs timestamps may not exactly match the timestamps of the spans in the trace it may be necessary to widen or shift the time range to find the desired logs.
Optional: Select tags to map. These tags can be used in the custom query with
${__tags}variable. This variable interpolates the mapped tags as list in an appropriate syntax for the data source. Only the tags that were present in the span are included; tags that aren’t present are omitted You can also configure a new name for the tag. This is useful in cases where the tag has dots in the name and the target data source doesn’t allow dots in labels. For example, you can remaphttp.statustohttp_status. If you don’t map any tags here, you can still use any tag in the query, for example,method="${__span.tags.method}". You can learn more about custom query variables here.Skip Filter by trace ID and Filter by span ID settings as these cannot be used with a custom query.
Switch on Use custom query.
Specify a custom query to be used to query the logs. You can use various variables to make that query relevant for current span. The link will only be shown only if all the variables are interpolated with non-empty values to prevent creating an invalid query.
Configure trace to logs
The following table describes the ways in which you can configure your trace to logs settings:
Trace to metrics
The Trace to metrics setting configures the trace to metrics feature available when integrating Grafana with Tempo.
There are two ways to configure the trace to metrics feature:
- Use a basic configuration with a default query, or
- Configure one or more custom queries where you can use a template language to interpolate variables from the trace or span.
Refer to the Trace to metrics configuration options section to learn about the available options.
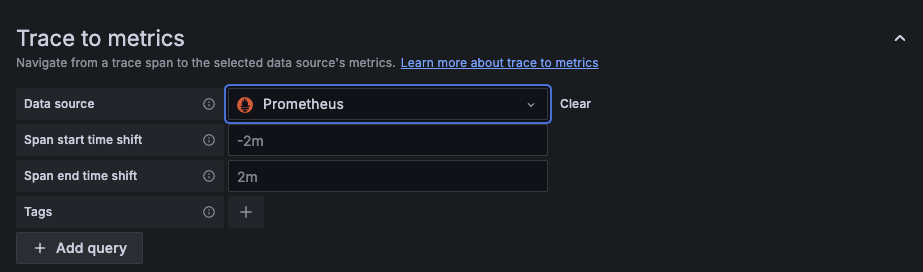
Set up a simple configuration
To use a simple configuration, follow these steps:
Select a metrics data source from the Data source drop-down.
Optional: Change Span start time shift and Span end time shift. You can change one or both of these settings. The default start time shift is -2 minutes and 2 minutes for end time shift.
Optional: Choose any tags to use in the query. If left blank, the default values of
cluster,hostname,namespace,pod,service.nameandservice.namespaceare used.The tags you configure must be present in the spans attributes or resources for a trace to metrics span link to appear. You can optionally configure a new name for the tag. This is useful for example if the tag has dots in the name and the target data source doesn’t allow using dots in labels. In that case you can for example remap
service.nametoservice_name.Don’t select Add query.
Select Save and Test.
Set up custom queries
To use custom queries, you need to configure the tags you’d like to include in the linked queries.
For each tag, the key is the span attribute name.
In cases where the attribute name would result in an invalid metrics query or doesn’t exactly match the desired label name, you can enter the label name as the second value.
For example, you could map the attribute k8s.pod to the label pod.
You can interpolate the configured tags using the $__tags keyword.
For example, when you configure the query requests_total{$__tags} with the tags k8s.pod=pod and cluster, it results in requests_total{pod="nginx-554b9", cluster="us-east-1"}.
The label values are dynamically inserted based on the span attributes’ values.
You can link to any metric you’d like, but metrics for span durations, counts, and errors filtered by service or span are a great starting point.
To use custom queries with the configuration, follow these steps:
Select a metrics data source from the Data source drop-down.
Optional: Choose any tags to use in the query. If left blank, the default values of
cluster,hostname,namespace,pod,service.nameandservice.namespaceare used.These tags can be used in the custom query with
${__tags}variable. This variable interpolates the mapped tags as list in an appropriate syntax for the data source and will only include the tags that were present in the span omitting those that weren’t present. You can optionally configure a new name for the tag. This is useful in cases where the tag has dots in the name and the target data source doesn’t allow using dots in labels. For example, you can remapservice.nametoservice_namein such a case. If you don’t map any tags here, you can still use any tag in the query like thismethod="${__span.tags.method}". You can learn more about custom query variables here.Click Add query to add a custom query.
Specify a custom query to be used to query metrics data.
Each linked query consists of:
- Link Label: (Optional) Descriptive label for the linked query.
- Query: The query ran when navigating from a trace to the metrics data source.
Interpolate tags using the
$__tagskeyword. For example, when you configure the queryrequests_total{$__tags}with the tagsk8s.pod=podandcluster, the result looks likerequests_total{pod="nginx-554b9", cluster="us-east-1"}.
Select Save and Test.
Trace to metrics configuration options
Trace to profiles
Using Trace to profiles, you can use Grafana’s ability to correlate different signals by adding the functionality to link between traces and profiles.
Trace to profiles lets you link your Grafana Pyroscope data source to tracing data. When configured, this connection lets you run queries from a trace span into the profile data using Explore. Each span links to your queries. Clicking a link runs the query in a split panel. If tags are configured, Grafana dynamically inserts the span attribute values into the query. The query runs over the time range of the (span start time - 60) to (span end time + 60 seconds).
Embedded flame graphs are also inserted into each span details section that has a linked profile. This lets you see resource consumption in a flame graph visualization for each span without having to navigate away from the current view.
There are two ways to configure the trace to profiles feature:
- Use a basic configuration with default query, or
- Configure a custom query where you can use a template language to interpolate variables from the trace or span.

Before you begin
Traces to profile requires a Tempo data source with Traces to profiles configured and a Grafana Pyroscope data source.
As with traces, your application needs to be instrumented to emit profiling data. For more information, refer to Linking tracing and profiling with span profiles.
Use a basic configuration
To use a basic configuration, follow these steps:
In the left menu, select Connections > Data sources.
Select your configured Tempo data source from the Data source list.
Scroll down to the Traces to profiles section.
Select a Pyroscope data source in the Data source drop-down.
Optional: Add one or more tags to use in the query. If left blank, the default values of
service.nameandservice.namespaceare used.The tags you configure must be present in the spans attributes or resources for a trace-to-profiles span link to appear.
You can optionally configure a new name for the tag. This is useful if the tag has dots in the name and the target data source doesn’t allow dots in labels. In that case, you can remap
service.nametoservice_name.Select one or more profile types to use in the query. Select the drop-down and choose options from the menu.
The profile type or app must be selected for the query to be valid. Grafana doesn’t show any data if the profile type or app isn’t selected when a query runs.
Select Save and Test.
If you have configured a Pyroscope data source and no profile data is available or the Profiles for this span
button and the embedded flame graph isn’t visible, verify that the pyroscope.profile.id key-value pair exists in your span tags.
Configure a custom query
To use a custom query with the configuration, follow these steps:
In the left menu, select Connections > Data sources.
Select a configured Tempo data source from the Data source list.
Scroll down to the Traces to profiles section.
Select a Pyroscope data source in the Data source drop-down.
Optional: Choose any tags to use in the query. If left blank, the default values of
service.nameandservice.namespaceare used.These tags can be used in the custom query with
${__tags}variable. This variable interpolates the mapped tags as list in an appropriate syntax for the data source. Only tags present in the span are included. Tags that aren’t present are omitted.You can also configure a name for the tag. Tag names are useful where the tag has dots in the name and the target data source doesn’t allow using dots in labels. For example, you can remap
service.nametoservice_name. If you don’t map any tags here, you can still use any tag in the query, for example:method="${__span.tags.method}". Learn more about custom query variables.Select one or more profile types to use in the query. Select the drop-down and choose options from the menu.
Switch on Use custom query to enter a custom query.
Specify a custom query to be used to query profile data. You can use various variables to make that query relevant for current span. The link shows only if all the variables are interpolated with non-empty values to prevent creating an invalid query. You can interpolate the configured tags using the
$__tagskeyword.Select Save and Test.
Configuration options
The following table describes options for configuring your Trace to profiles settings:
Custom query variables
To use a variable in your trace to logs, metrics, or profiles, you need to wrap it in ${}.
For example, ${__span.name}.
Additional settings
Use the down arrow to expand the Additional settings section to view these options.
Advanced HTTP settings
The Grafana Proxy deletes forwarded cookies. Use the Allowed cookies field to specify cookies by name that should be forwarded to the data source.
The Timeout field sets the HTTP request timeout in seconds.
Service graph
The Service graph setting configures the Service Graph data.
Configure the Data source setting to define in which Prometheus instance the Service Graph data is stored.
To use the Service Graph, refer to the Service Graph documentation.
Node graph
The Node graph setting enables the node graph visualization, which isn’t activated by default.
Once activated, Grafana displays the node graph above the trace view.
Tempo search
The Search setting configures Tempo search.
You can configure the Hide search setting to hide the search query option in Explore if search is not configured in the Tempo instance.
TraceID query
The TraceID query setting modifies how TraceID queries are run. The time range can be used when there are performance issues or timeouts since it will narrow down the search to the defined range. This setting is disabled by default.
You can configure this setting as follows:
Span bar
The Span bar setting helps you display additional information in the span bar row.
You can choose one of three options:
Private data source connect
Note
This feature is only available in Grafana Cloud.
Use private data source connect (PDC) to connect to and query data within a secure network without opening that network to inbound traffic from Grafana Cloud.
Refer to Private data source connect for more information on how PDC works and Configure Grafana private data source connect (PDC) for steps on setting up a PDC connection.
Use the drop-down list to select a configured private data source. If you make changes, select Test & save to preserve your changes.
Use Manage private data source connect to configure and manage any private data sources you have configured.
Provision the data source
You can define and configure the Tempo data source in YAML files as part of the Grafana provisioning system. Provisioning is primarily used Grafana instances that don’t use Grafana Cloud.
You can use version control, like git, to track and manage file changes. Changes can be updated or rolled back as needed.
For more information about provisioning and available configuration options, refer to Provisioning Grafana.
Note
You can’t modify a provisioned data source using the Tempo data source settings in Grafana. Grafana displays a message for provisioned data sources.
Example file
This example provision YAML file sets up the equivalents of the options available in the Tempo data source user interface.
apiVersion: 1

datasources:
  - name: Tempo
    type: tempo
    uid: EbPG8fYoz
    url: http://localhost:3200
    access: proxy
    basicAuth: false
    jsonData:
      tracesToLogsV2:
        # Field with an internal link pointing to a logs data source in Grafana.
        # datasourceUid value must match the uid value of the logs data source.
        datasourceUid: 'loki'
        spanStartTimeShift: '-1h'
        spanEndTimeShift: '1h'
        tags: ['job', 'instance', 'pod', 'namespace']
        filterByTraceID: false
        filterBySpanID: false
        customQuery: true
        query: 'method="$${__span.tags.method}"'
      tracesToMetrics:
        datasourceUid: 'prom'
        spanStartTimeShift: '1h'
        spanEndTimeShift: '-1h'
        tags: [{ key: 'service.name', value: 'service' }, { key: 'job' }]
        queries:
          - name: 'Sample query'
            query: 'sum(rate(traces_spanmetrics_latency_bucket{$$__tags}[5m]))'
      tracesToProfiles:
        datasourceUid: 'grafana-pyroscope-datasource'
        tags: ['job', 'instance', 'pod', 'namespace']
        profileTypeId: 'process_cpu:cpu:nanoseconds:cpu:nanoseconds'
        customQuery: true
        query: 'method="$${__span.tags.method}"'
      serviceMap:
        datasourceUid: 'prometheus'
      nodeGraph:
        enabled: true
      search:
        hide: false
      traceQuery:
        timeShiftEnabled: true
        spanStartTimeShift: '1h'
        spanEndTimeShift: '-1h'
      spanBar:
        type: 'Tag'
        tag: 'http.path'

