
Important: This documentation is about an older version. It's relevant only to the release noted, many of the features and functions have been updated or replaced. Please view the current version.
Grafana Explore Metrics
Grafana Explore Metrics is a query-less experience for browsing Prometheus-compatible metrics. Quickly find related metrics with just a few simple clicks, without needing to write PromQL queries to retrieve metrics.
Caution
Explore Metrics is currently in public preview. Grafana Labs offers limited support, and breaking changes might occur prior to the feature being made generally available.
With Explore Metrics, you can:
- easily slice and dice metrics based on their labels, so you can immediately see anomalies and identify issues
- see the right visualization for your metric based on its type (gauge vs. counter, for example) without building it yourself
- surface other metrics relevant to the current metric
- “explore in a drawer” - expand a drawer over a dashboard with more content so you don’t lose your place
- view a history of user steps when navigating through metrics and their filters
You can access Explore Metrics either as a standalone experience or as part of Grafana dashboards.
Standalone experience
To access Explore Metrics as a standalone experience:
- Click the arrow next to Explore in the Grafana left-side menu and click Metrics. You are taken to an overview page that shows recent metrics, bookmarks, and the option to select a new metric exploration.
- To get started with a new exploration, click + New metric exploration.
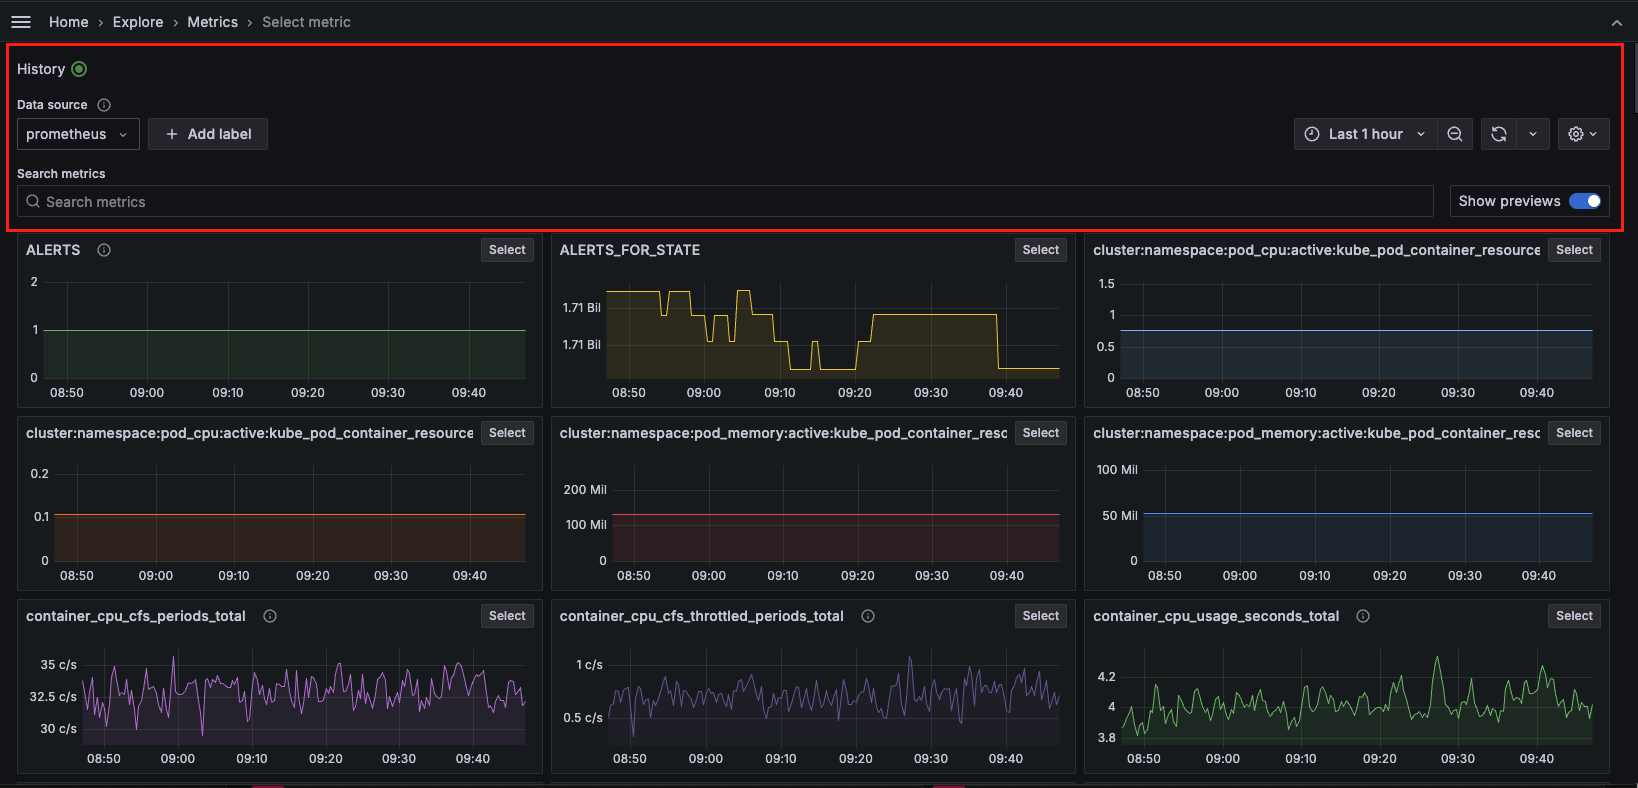
- Select Prometheus or any Prometheus-compatible data source available in the drop-down menu under Data source.
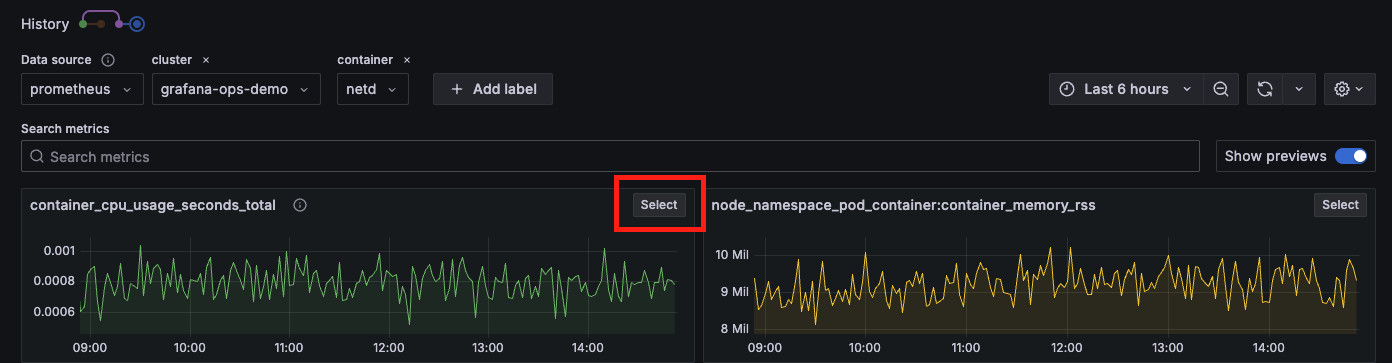
- Click + Add label to select a label-value pair from the drop-down menu. You can add multiple label-value pairs. A label type will appear above the selected label with a drop-down list of options from which to choose. For example, if you select the label
containera drop-down list of available containers appears. - You can also search for metrics using keywords under Search metrics in the search bar.
- Use the time picker to select a date and time range from the drop-down menu or use an absolute time range.
- Click the down arrow next to the Refresh icon to set a refresh rate from the drop-down menu. The default is
Off. - Click the Settings icon and toggle Always keep selected metric graph in-view to keep your main graph always in view on the Breakdown drill-down tab.
The History button in the upper left corner tracks every step navigating through metric exploration.
Metrics exploration
To further explore a metric, click Select in the upper right corner of the metric visualization.
- The Overview tab provides a description for each metric, as well as the metric
typeandunitassociated with the metric. It also provides a list of labels associated with the metric. Click on any label to view drill-down visualizations. - The Breakdown tab depicts time series visualizations for each of the label-value pairs for the selected metric. You can further drill down on each label and click Add to filter to add the label/value pair into your filters. You can also change the View from grid to rows.
- The Related metrics tab depicts related metrics with relevant key words. You can repeat the drill down process for any related metric. Toggle SHow previews to preview visualizations.
Once you have gathered your metrics exploration data you can:
- Click the Explore icon on the right side to open the graph in Explore, where you can modify the query or add the graph to a dashboard or incident.
- Click the Share icon on the right side to copy the metric drill down URL to the clipboard so it can be shared.
- Click the Star icon on the right side to bookmark and save the metrics exploration.
Dashboard experience
To access Explore Metrics via a dashboard:
- Navigate to your dashboard.
- Select a time series panel.
- Click the panel menu in the upper right and select Explore Metrics. If there are multiple metrics, click on the one you want to explore.
- You will see a slide out drawer with the Metrics Experience, starting with the drill down. You can access the standalone experience by clicking Open in the upper right.
Was this page helpful?
Related resources from Grafana Labs


