
Important: This documentation is about an older version. It's relevant only to the release noted, many of the features and functions have been updated or replaced. Please view the current version.
Manage dashboards
This topic includes techniques you can use to manage your Grafana dashboards, including:
- Creating and managing dashboard folders
- Exporting and importing dashboards
- Organizing dashboards
- Troubleshooting dashboards
For more information about creating dashboards, refer to Add and organize panels.
Browse dashboards
On the Dashboards page, you can browse and manage folders and dashboards. This includes the options to:
- Create folders and dashboards
- Move dashboards between folders.
- Delete multiple dashboards and folders.
- Navigate to a folder.
- Manage folder permissions. For more information, refer to Dashboard permissions.
Note
As of Grafana 10.2, there is no longer a special General folder. Dashboards without a folder are now shown at the top level alongside folders.
Create a dashboard folder
Folders help you organize and group dashboards, which is useful when you have many dashboards or multiple teams using the same Grafana instance.
Before you begin: Ensure you have Editor permissions or greater to create folders. For more information about dashboard permissions, refer to Dashboard permissions.
To create a dashboard folder:
- Click Dashboards in the main menu.
- On the Dashboards page, click New and select New folder in the drop-down.
- Enter a unique name and click Create.
When you save a dashboard, you can either select a folder for the dashboard to be saved in or create a new folder.
Note
Alerts can’t be placed in folders with slashes (\ /) in the name. If you wish to place alerts in the folder, don’t use slashes in the folder name.
To edit the name of a folder:
- Click Dashboards in the main menu.
- Navigate to the folder by selecting it in the list, or searching for it.
- Click the pencil icon labelled Edit title in the header and update the name of the folder.
The new folder name is automatically saved.
Folder permissions
You can assign permissions to a folder. Dashboards in the folder inherit any permissions that you’ve assigned to the folder. You can assign permissions to organization roles, teams, and users.
To modify permissions for a folder:
- Click Dashboards in the main menu.
- Navigate to the folder by selecting it in the list, or searching for it.
- On the folder’s page, click Folder actions and select Manage permissions in the drop-down.
- Update the permissions as desired.
Changes are saved automatically.
For more information about dashboard permissions, refer to Dashboard permissions.
Export and import dashboards
You can use the Grafana UI or the HTTP API to export and import dashboards.
Export a dashboard
The dashboard export action creates a Grafana JSON file that contains everything you need, including layout, variables, styles, data sources, queries, and so on, so that you can later import the dashboard.
Click Dashboards in the main menu.
Open the dashboard you want to export.
Click the Share icon in the top navigation bar.
Click Export.
If you’re exporting the dashboard to use in another instance, with different data source UIDs, enable the Export for sharing externally switch.
Click Save to file.
Grafana downloads a JSON file to your local machine.
Make a dashboard portable
If you want to export a dashboard for others to use, you can add template variables for things like a metric prefix (use a constant variable) and server name.
A template variable of the type Constant is automatically hidden in the dashboard, and is also added as a required input when the dashboard is imported.
Import a dashboard
Click Dashboards in the left-side menu.
Click New and select Import in the dropdown menu.
Perform one of the following steps:
- Upload a dashboard JSON file
- Paste a Grafana.com dashboard URL
- Paste dashboard JSON text directly into the text area
The import process enables you to change the name of the dashboard, pick the data source you want the dashboard to use, and specify any metric prefixes (if the dashboard uses any).
Discover dashboards on grafana.com
Find dashboards for common server applications at Grafana.com/dashboards.
Set up generative AI features for dashboards
Note
Generative AI in dashboards is currently in public preview. Grafana Labs offers limited support, and breaking changes might occur prior to the feature being made generally available. Enable thedashgptfeature toggle in Grafana to use this feature. Contact Grafana Support to enable this feature in Grafana Cloud.
You can use generative AI to help you with the following tasks:
- Generate panel and dashboard titles and descriptions: Generate a title and description based on the data you’ve added for your panel or dashboard. This is useful when you want to visualize your data quickly and don’t want to spend time coming up with a title or description.
- Generate dashboard save changes summary: Generate a summary of the changes you’ve made to a dashboard when you save it. This is great for easily tracking the history of a dashboard.
To access these features, enable the dashgpt feature toggle. Then install and configure Grafana’s Large Language Model (LLM) app plugin. For more information, refer to the Grafana LLM plugin documentation.
When enabled, the ✨ Auto generate option displays next to the Title and Description fields in your panels and dashboards, or when you press the Save button.
Troubleshoot dashboards
This section provides information to help you solve common dashboard problems.
Dashboard is slow
- Are you trying to render dozens (or hundreds or thousands) of time-series on a graph? This can cause the browser to lag. Try using functions like
highestMax(in Graphite) to reduce the returned series. - Sometimes the series names can be very large. This causes larger response sizes. Try using
aliasto reduce the size of the returned series names. - Are you querying many time-series or for a long range of time? Both of these conditions can cause Grafana or your data source to pull in a lot of data, which may slow it down.
- It could be high load on your network infrastructure. If the slowness isn’t consistent, this may be the problem.
Dashboard refresh rate issues
By default, Grafana queries your data source every 30 seconds. Setting a low refresh rate on your dashboards puts unnecessary stress on the backend. In many cases, querying this frequently isn’t necessary because the data isn’t being sent to the system such that changes would be seen.
We recommend the following:
- Only enable auto-refreshing on dashboards, panels, or variables unless if necessary. Users can refresh their browser manually, or you can set the refresh rate for a time period that makes sense (every ten minutes, every hour, and so on).
- If it’s required, then set the refresh rate to once a minute. Users can always refresh the dashboard manually.
- If your dashboard has a longer time period (such as a week), then you really don’t need automated refreshing.
Handling or rendering null data is wrong or confusing
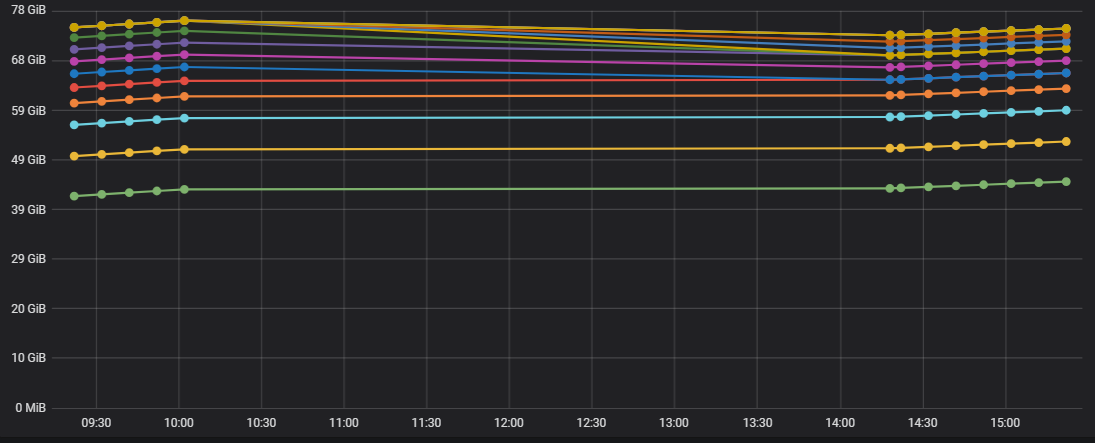
Some applications publish data intermittently; for example, they only post a metric when an event occurs. By default, Grafana graphs connect lines between the data points. This can be very deceiving.
In the picture below we’ve enabled:
- Points and 3-point radius to highlight where data points are actually present.
- **Connect null values* is set to **Always**.
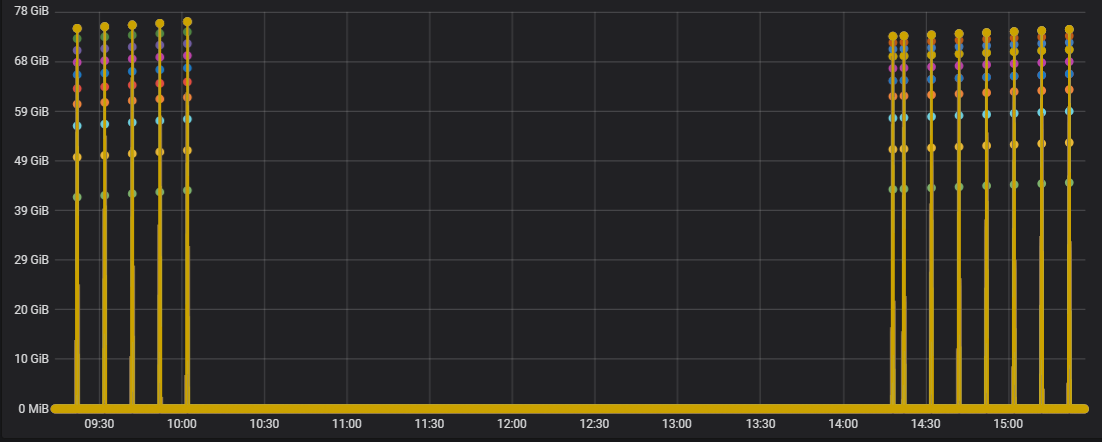
In this graph, we set graph to show bars instead of lines and set the No value under Standard options to 0. There is a very big difference in the visuals.
More examples
You can find more examples in public/dashboards/ directory of your Grafana installation.
Was this page helpful?
Related resources from Grafana Labs


