Important: This documentation is about an older version. It's relevant only to the release noted, many of the features and functions have been updated or replaced. Please view the current version.
What’s new in Grafana v10.1
Welcome to Grafana 10.1! Read on to learn about changes to dashboards and visualizations, data sources, security and authentication and more. We’re particularly excited about a set of improvements to visualizing logs from Loki and other logging data sources in Explore mode, and our Flame graph panel, used to visualize profiling data from Pyroscope and other continuous profiling data sources.
For even more detail about all the changes in this release, refer to the changelog. For the specific steps we recommend when you upgrade to v10.1, check out our Upgrade Guide.
Dashboards and visualizations
Flame graph improvements
Generally available in all editions of Grafana
We’ve added four new features to the Flame graph visualization:
- Sandwich view: You can now show a sandwich view of any symbol in the flame graph. Sandwich view shows all the callers on the top and all the callees of the symbol on the bottom. This is useful when you want to see the context of a symbol.
- Switching color scheme: You can now switch color scheme between a color gradient based on the relative value of a symbol or by the package name of a symbol.
- Switching symbol name alignment: Symbols with long names may be hard to differentiate if they have the same prefix. This new option allows you to align the text to the left or right so you can see the part of the symbol name that’s important.
- Improved navigation: You can highlight a symbol or enable sandwich view for a symbol from the table. Also, a new status bar on top of the flame graph displays which views are enabled.
Distinguish widgets from visualizations
Experimental in all editions of Grafana
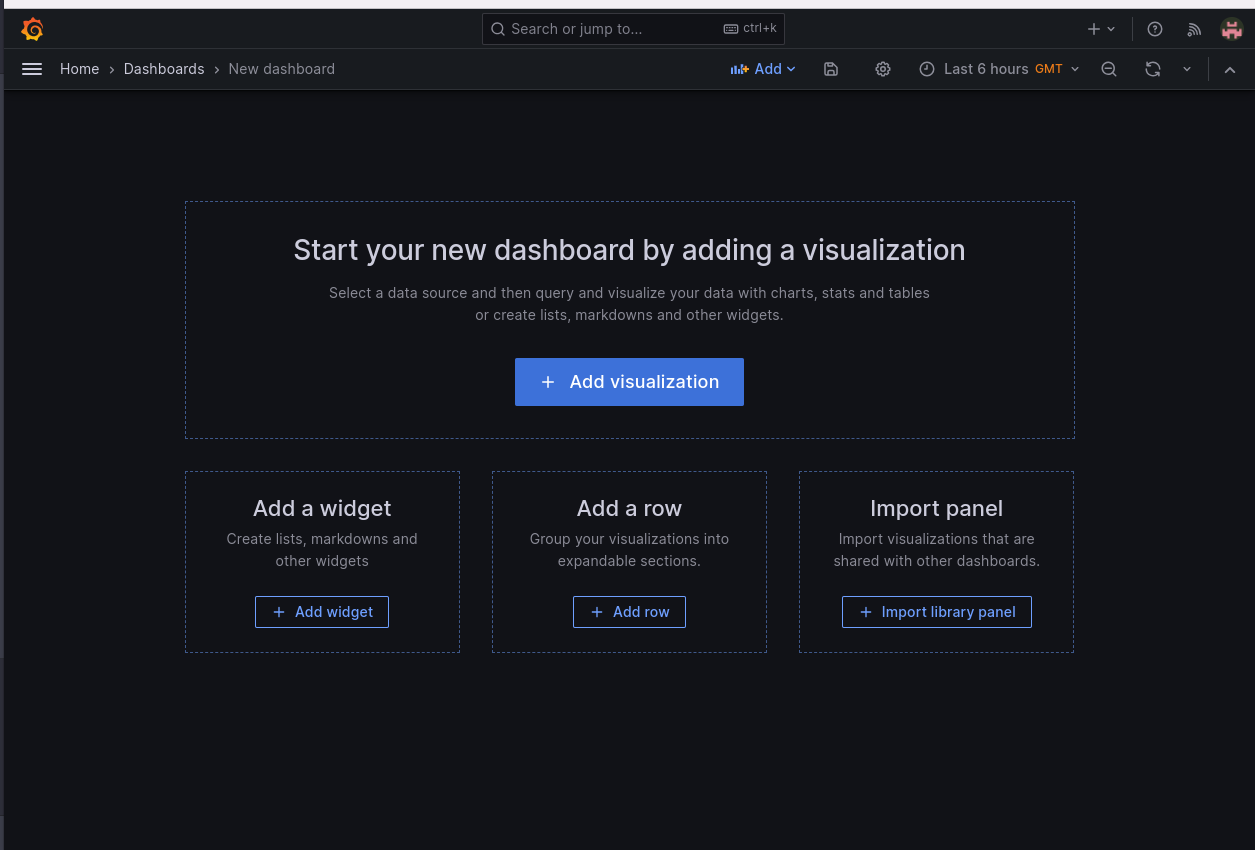
This experimental feature introduces a clear distinction between two different categories of panel plugin types: visualization panels that consume a data source and a new type, called widgets, that don’t require a data source.
Now, you can easily add widgets like Text, News, and Annotation list without the need to select a data source. The plugins list and library panels are filtered based on whether you’ve selected a widget or visualization, providing a streamlined editing experience.
To see the widget editor in Grafana OSS or Enterprise, enable the vizAndWidgetSplit feature toggle. If you’re using Grafana Cloud and would like to enable this feature, please contact customer support.
Transformations redesign
Available in public preview in all editions of Grafana
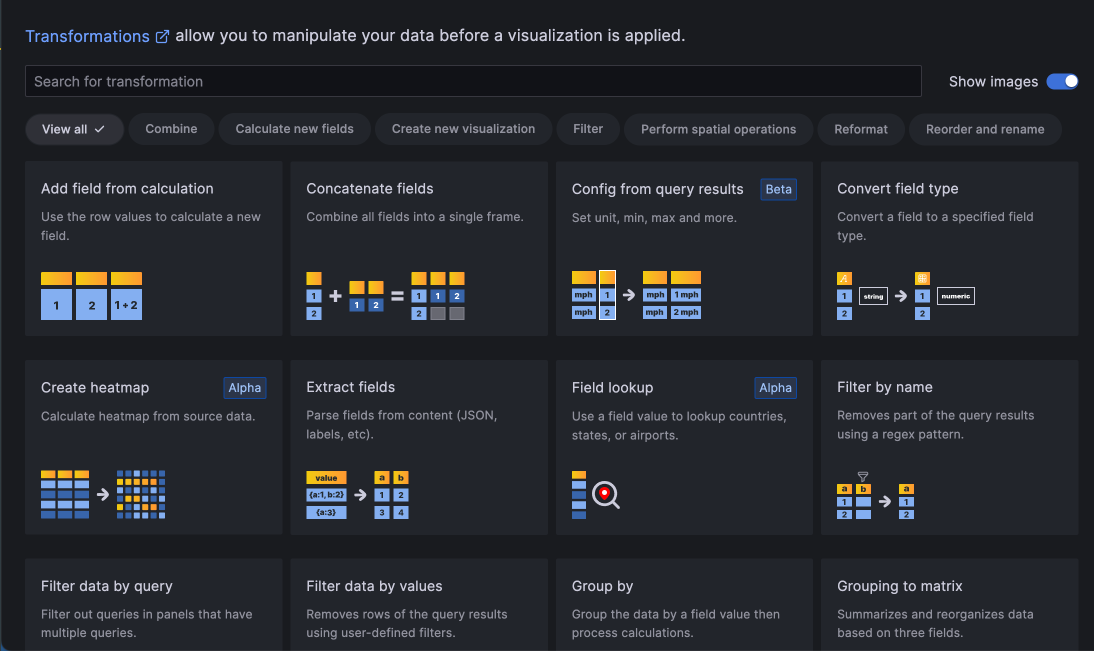
The transformations tab has an improved user experience and visual redesign. Now, transformations are categorized, and each transformation type has an illustration to help you choose the right one.
Format Time transformation
Available in public preview in all editions of Grafana
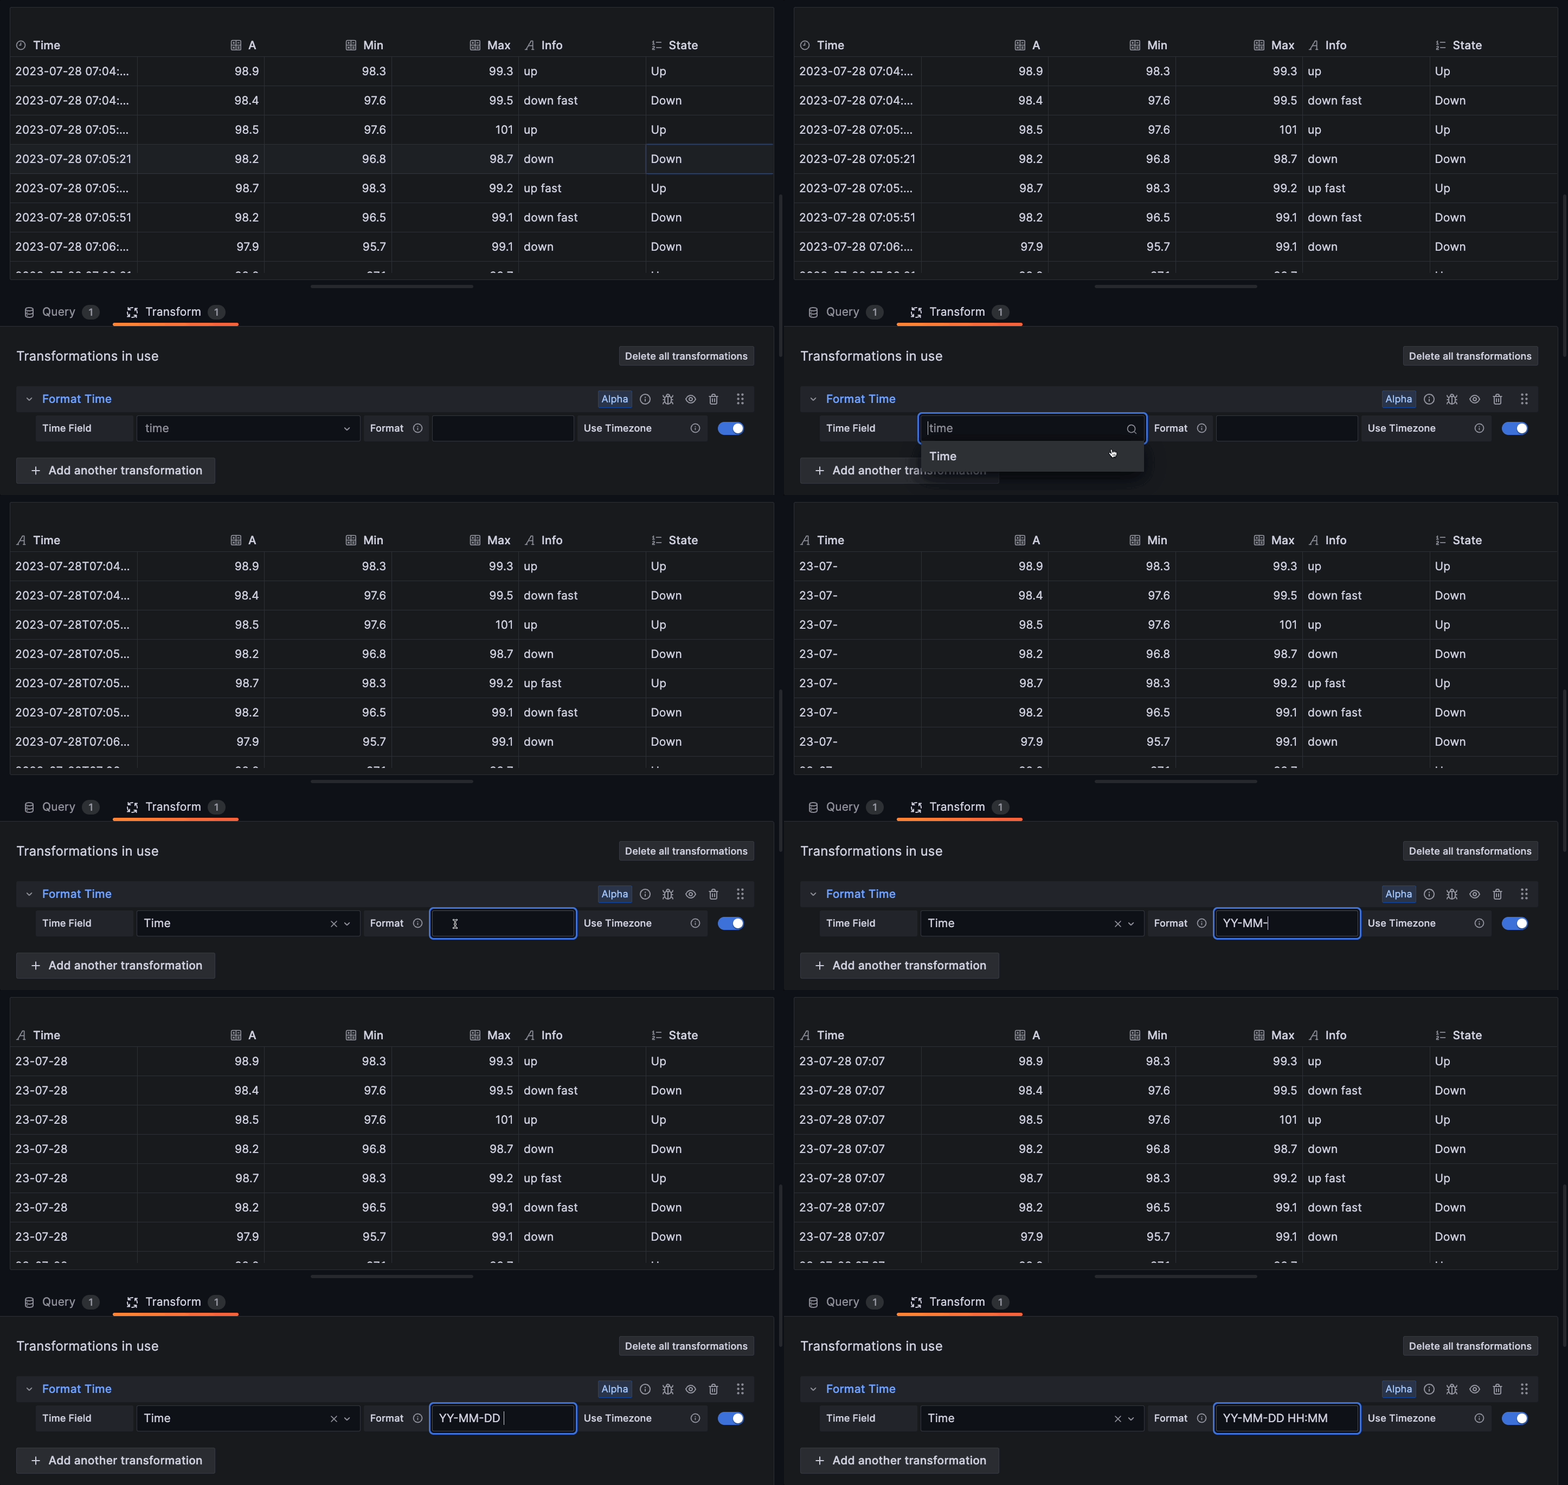
When working with date and time data, it can be useful to have different time formats. With the new Format Time transformation, you can convert any time format to any other one supported by Moment.js. When used in conjunction with the Group by transformation, this can also be used to bucket days, weeks, and other time windows together.
Join by fields transformation outer join (tabular) option
Generally available in all editions of Grafana
The Join by field transformation has a new option: outer join (tabular). This option is a true outer join for tabular (SQL-like) data. Data can now be joined on a field value that is not distinct. This is different from the previous outer join, which is optimized for time-series data where the join values are never repeated.
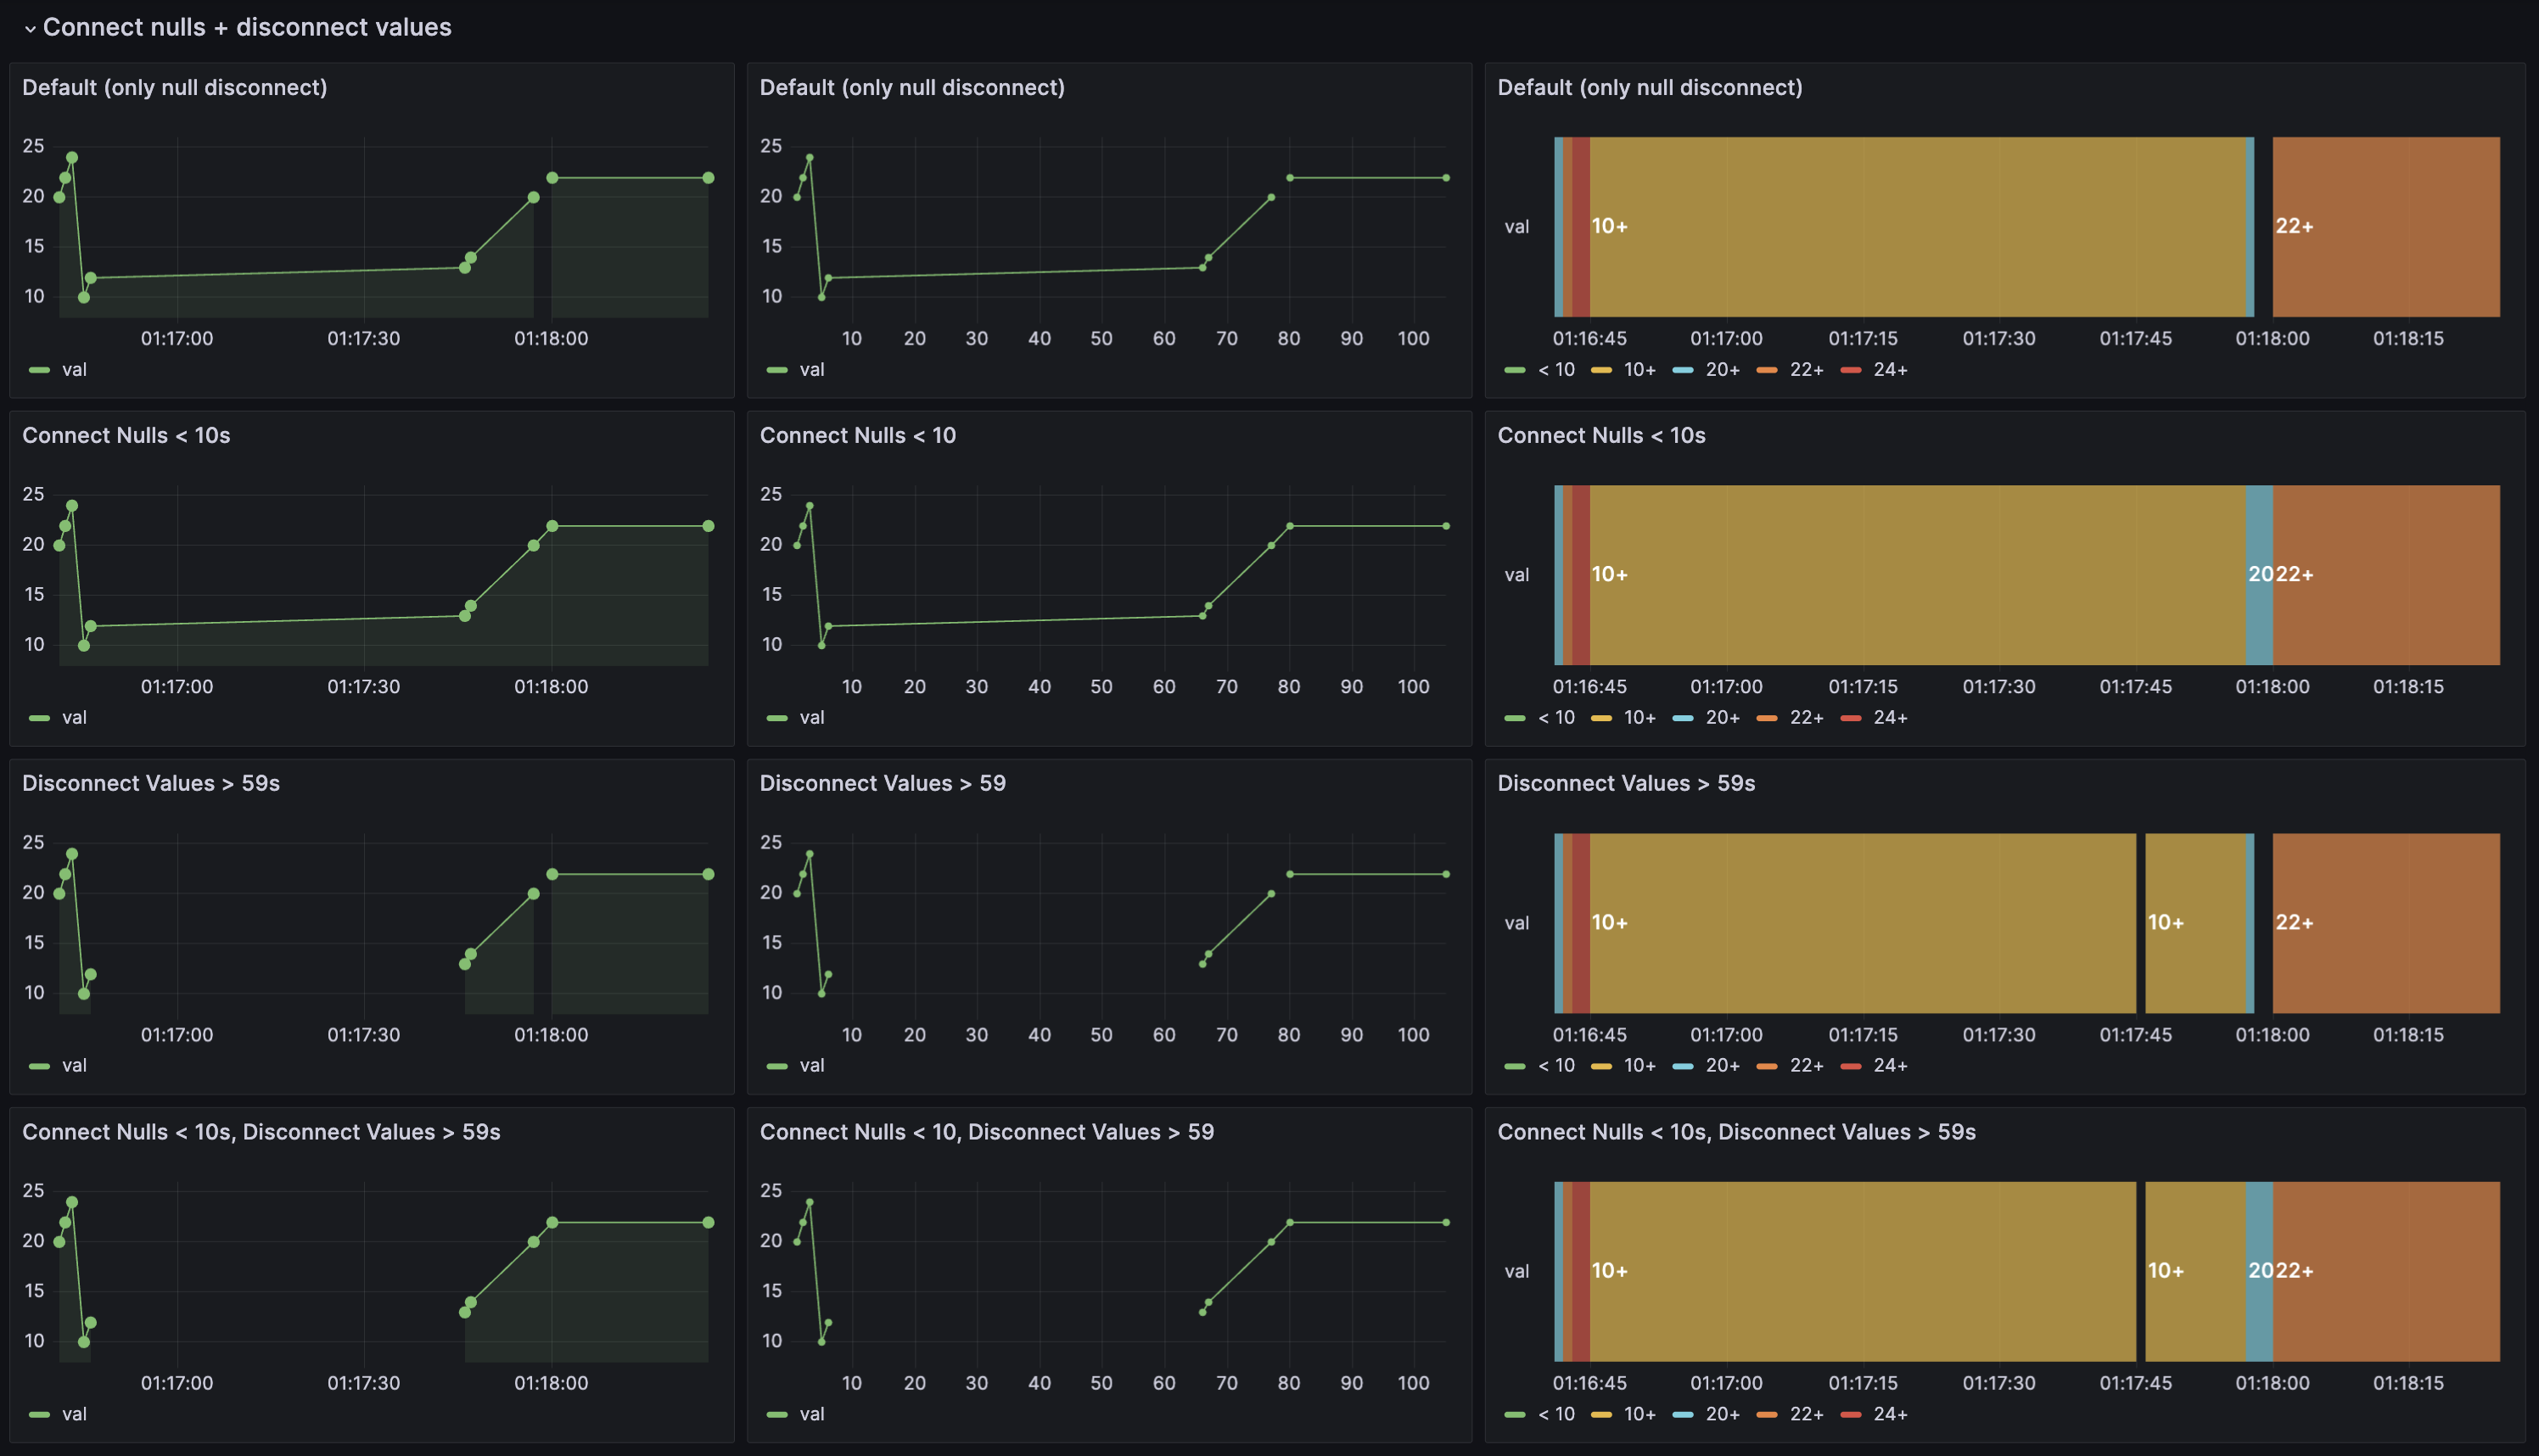
Disconnect values in Time series, Trend, and State timeline visualizations
Generally available in all editions of Grafana
You can now choose whether to set a threshold above which values in the data should be disconnected. This can be useful in cases where you have sensors that report a value at a set interval, but you want to disconnect the values when the sensor does not respond. This feature complements the existing connect null values functionality.
To learn more, refer to our disconnect values documentation.
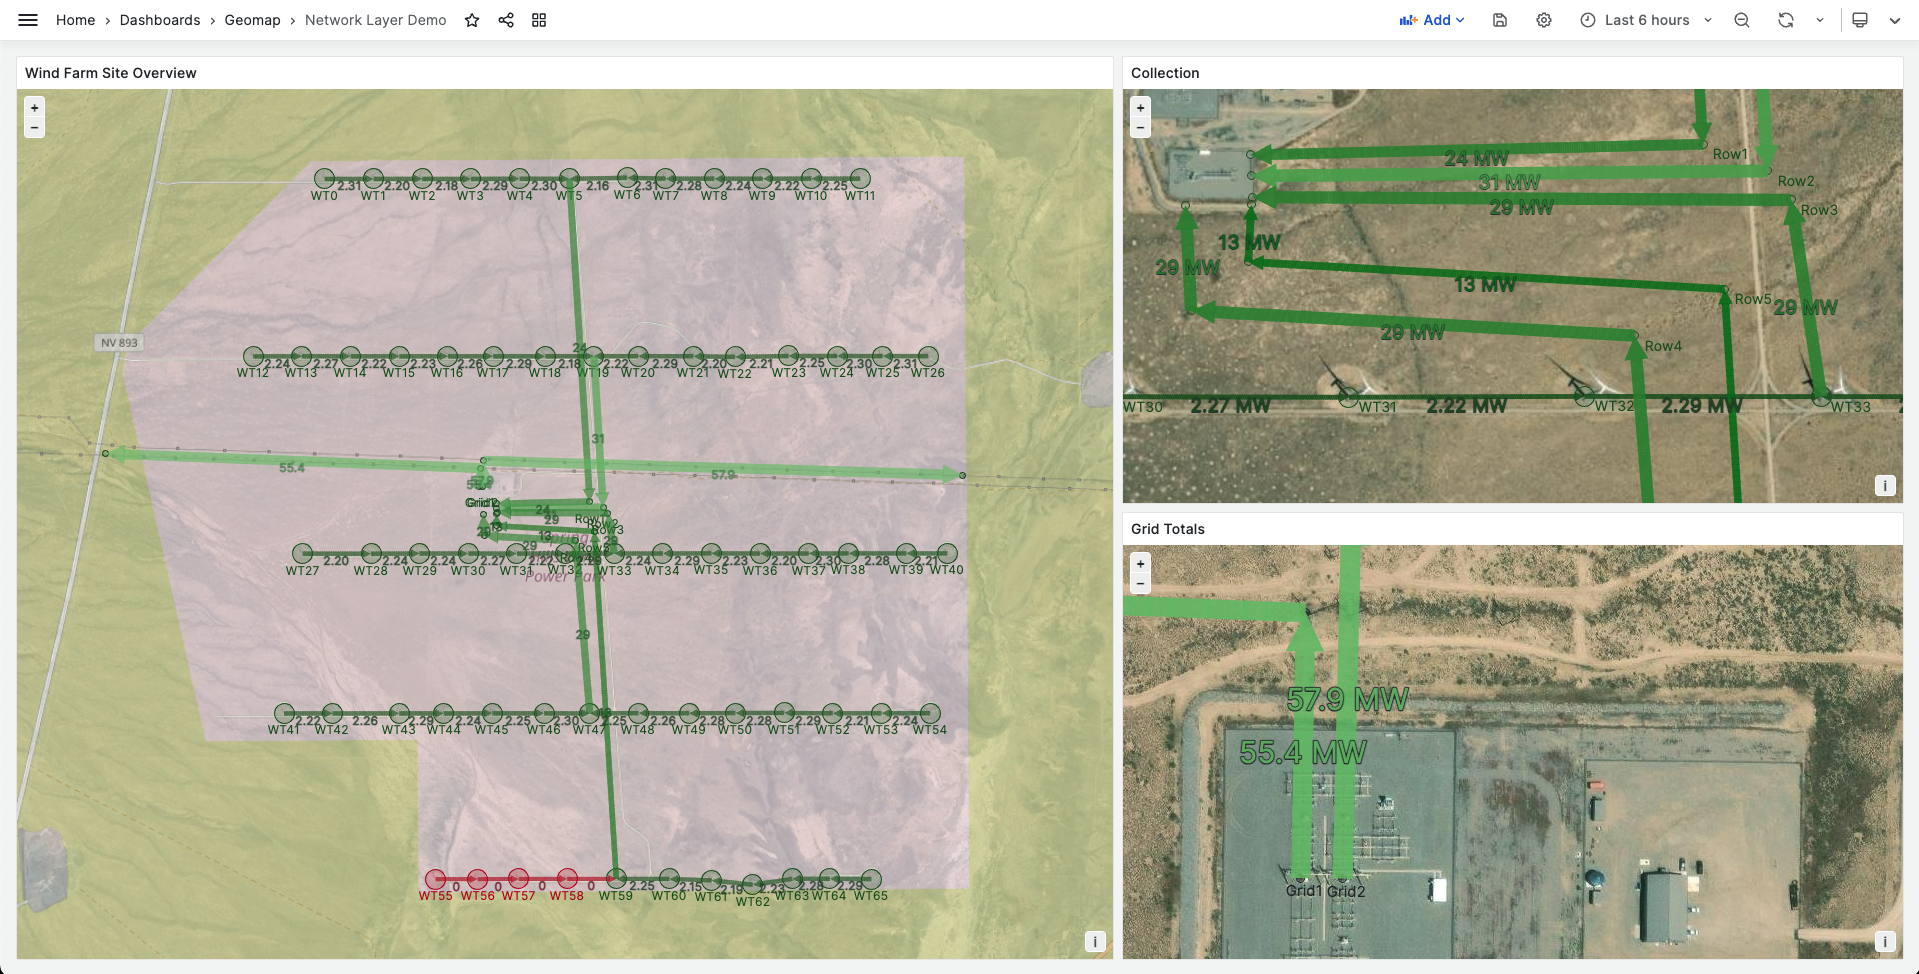
Geomap Network layer
Available in public preview in all editions of Grafana
You can now display network data in the Geomap visualization by using the new beta Network layer. This layer supports the same data format as the Node graph visualization.
To learn more, refer to our Geomap network layer documentation.
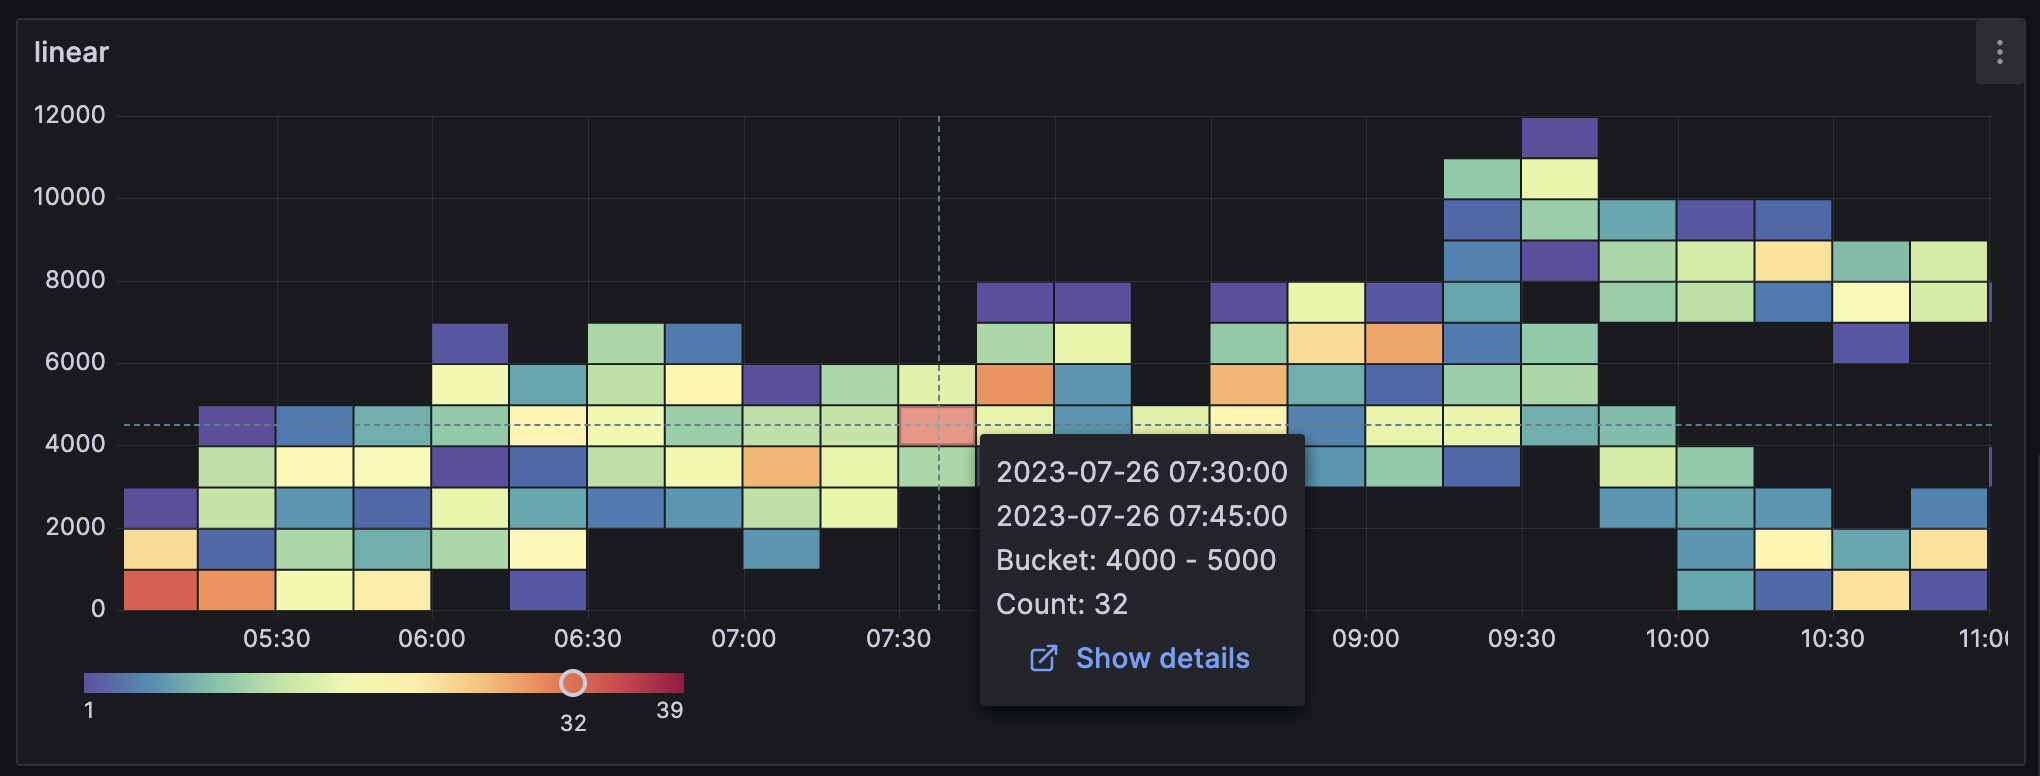
Heatmap visualizations now support data links
Generally available in all editions of Grafana
You can now add data links to Heatmap visualizations. This allows you to add links to other dashboards, panels, or external URLs that are relevant to the data in your heatmap. We’re pleased to highlight that this feature was a community contribution.
To learn more, refer to both our Heatmap documentation and our Configure data links documentation.
Activate draft reports
Generally available in Grafana Enterprise, Cloud Free, Cloud Pro, and Cloud Advanced
You can now use the resume and pause report functionality to activate draft reports that have all the required fields filled in.
To learn more, refer to our Create and manage reports documentation.
Data sources
Step editor in Loki
Generally available in all editions of Grafana
We’ve improved the Loki query editor by adding a new Step editor field. This field allows you to specify a value for the step parameter in Loki queries. You can use this parameter when making metric queries to Loki or when you want a matrix response from your queries.
By default, the step parameter is set to the value of the $__interval variable. This variable is calculated based on the time range and the width of the graph (in pixels). To learn more about the Loki step parameter, refer to our Loki step parameter documentation.

Copy link to a Loki log line
Generally available in all editions of Grafana
New functionality for linking of Loki log lines in Explore allows you to quickly navigate to specific log entries for precise analysis. By clicking the Copy shortlink button for a log line, you can generate and copy a short URL that provides direct access to the exact log entry within an absolute time range. When you open the link, Grafana automatically scrolls to the corresponding log line and highlights it, making it easy to identify and focus on the relevant information.

TraceQL response streaming in Tempo
Experimental in all editions of Grafana
Grafana’s Tempo data source now supports streaming responses to TraceQL queries. With this feature, you can now see partial query results as they come in, so you no longer have to wait for the whole query to finish. This is perfect for big queries that take a long time to return a response.
To use this feature, enable the traceQLStreaming feature toggle. If you’re using Grafana Cloud and would like to enable this feature, please contact customer support.
Streaming is available for both the Search and TraceQL query types, and you’ll get immediate visibility of incoming traces on the results table. This smooth integration makes data exploration a breeze and speeds up decision-making.
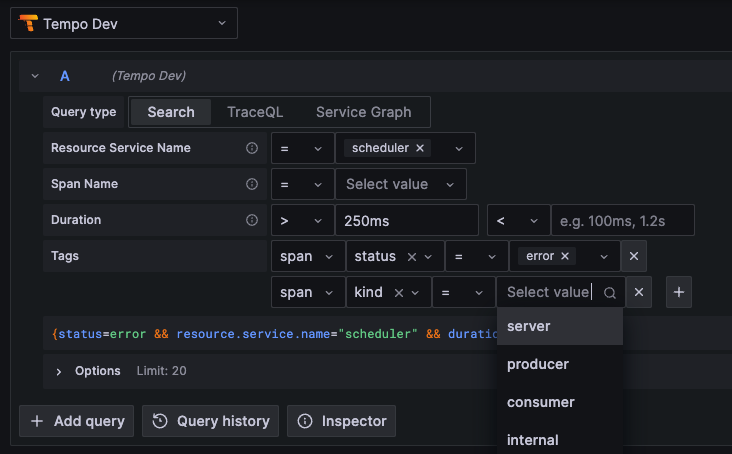
Tempo Search powered by TraceQL
Generally available in all editions of Grafana
The Search query type was replaced with a new editor powered by TraceQL. This new editor allows you to use the same query language for both Search and TraceQL queries. This change also brings a new UI that makes it easier to write queries and explore your data while using the powerful features offered by TraceQL.
The previous Search interface is now deprecated and will be removed in a future release. We recommend that you start using the new editor as soon as possible and migrate existing dashboards.
Span filtering for traces is GA
Generally available in all editions of Grafana
Since the last release, we’ve made several improvements to span filtering. Now, we’re promoting span filters out of public preview and into general availability.
Span filters allow you to work much more efficiently with traces that consist of a large number of spans. Span filters exist above the trace view and allow you to filter the spans that are shown in the trace view. The more filters you add, the more specific the filtered spans.
Currently, you can add one or more of the following filters:
- Service Name
- Span Name
- Duration
- Tags (which includes tags, process tags, and log fields)
To only show the spans you’ve matched, you can enable the Show matches only toggle.
Learn more about span filtering in our Tempo data source documentation.

Configuration page redesign for Loki and Elasticsearch
Generally available in all editions of Grafana
The Loki and Elasticsearch data source configuration pages have been redesigned to make getting started and setting up data sources as simple and easy to understand as possible. You can now find new subsections with links to documentation pages, as well as tooltips to assist you with configuring and customizing data sources.
Easier to use query editor for Elasticsearch
Generally available in all editions of Grafana
The Elasticsearch query editor now allows convenient switching between logs, metrics, and raw data directly from the top, eliminating the need to go through the metric selector.
Metrics explorer
Generally available in all editions of Grafana
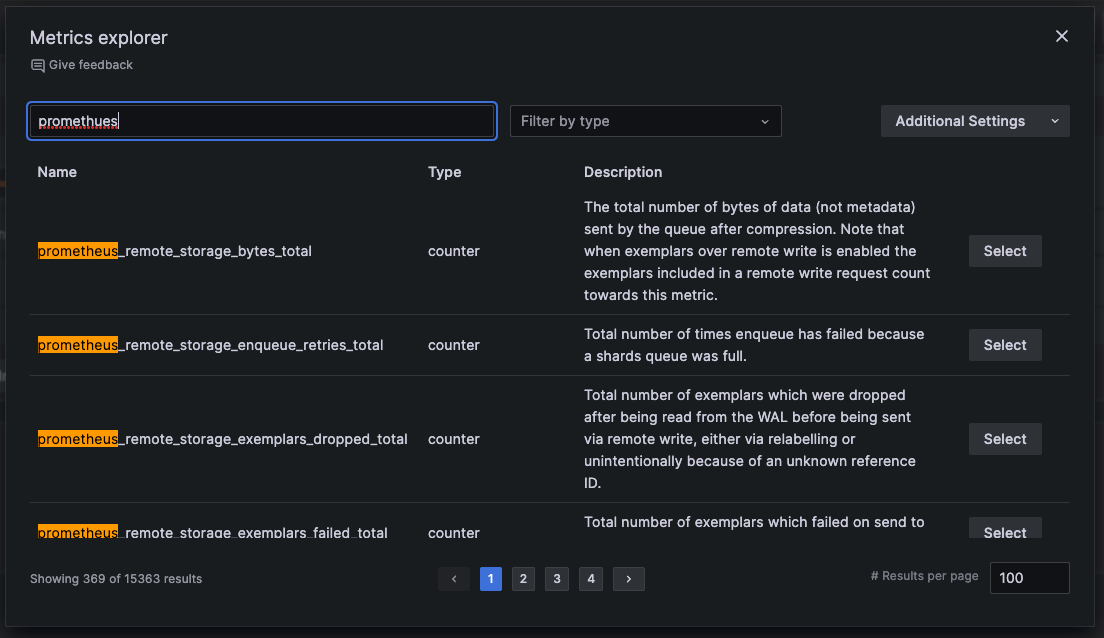
The Metrics explorer is a new feature that enhances metrics browsing in the Prometheus query builder. The Metrics explorer makes it easier for you to find the right metric and get comfortable with PromQL. You can now explore metrics with additional metadata, perform fuzzy search on the metric name or description, and filter on the Prometheus type.
Redshift and Athena: Async query data support
Generally available in all editions of Grafana
Async query data support in Redshift and Athena makes queries over multiple requests (starting, checking status, and fetching the results) instead of in a single request query. This is useful for queries that can potentially run for a long time and time out. This feature was previously available behind a feature toggle and is now be generally available and enabled by default.
Redshift and Athena: Async query caching
Experimental in Grafana Enterprise, Cloud Pro, and Cloud Advanced
This feature adds support for query caching of async queries in the Athena and Redshift data source plugins. To try this feature, enable both the useCachingService and awsAsyncQueryCaching feature toggles. If you’re using Grafana Cloud and would like to enable this experimental feature, please contact customer support.
CloudWatch logs Monaco query editor
Experimental in all editions of Grafana
The CloudWatch logs query editor is moving from being a Slate-based editor to a Monaco-based editor. This new Monaco-based editor provides improved syntax highlighting, and auto-completion. To use the Monaco-based query editor, enable the cloudWatchLogsMonacoEditor feature toggle. If you’re using Grafana Cloud and would like to enable this feature, please contact customer support.
InfluxDB backend mode
Available in public preview in all editions of Grafana
Previously, InfluxDB backend mode was available, however, there were compatibility issues that needed to be addressed. In this release, we’ve addressed these issues and
promoted this feature from experimental to public preview. In the future, backend mode will be the default, and we’ll deprecate frontend mode. To try backend mode, enable the influxdbBackendMigration feature toggle. If you’re using Grafana Cloud and would like to enable this feature, please contact customer support.
Explore
Logs: Choose which fields to display in a log line
Generally available in all editions of Grafana
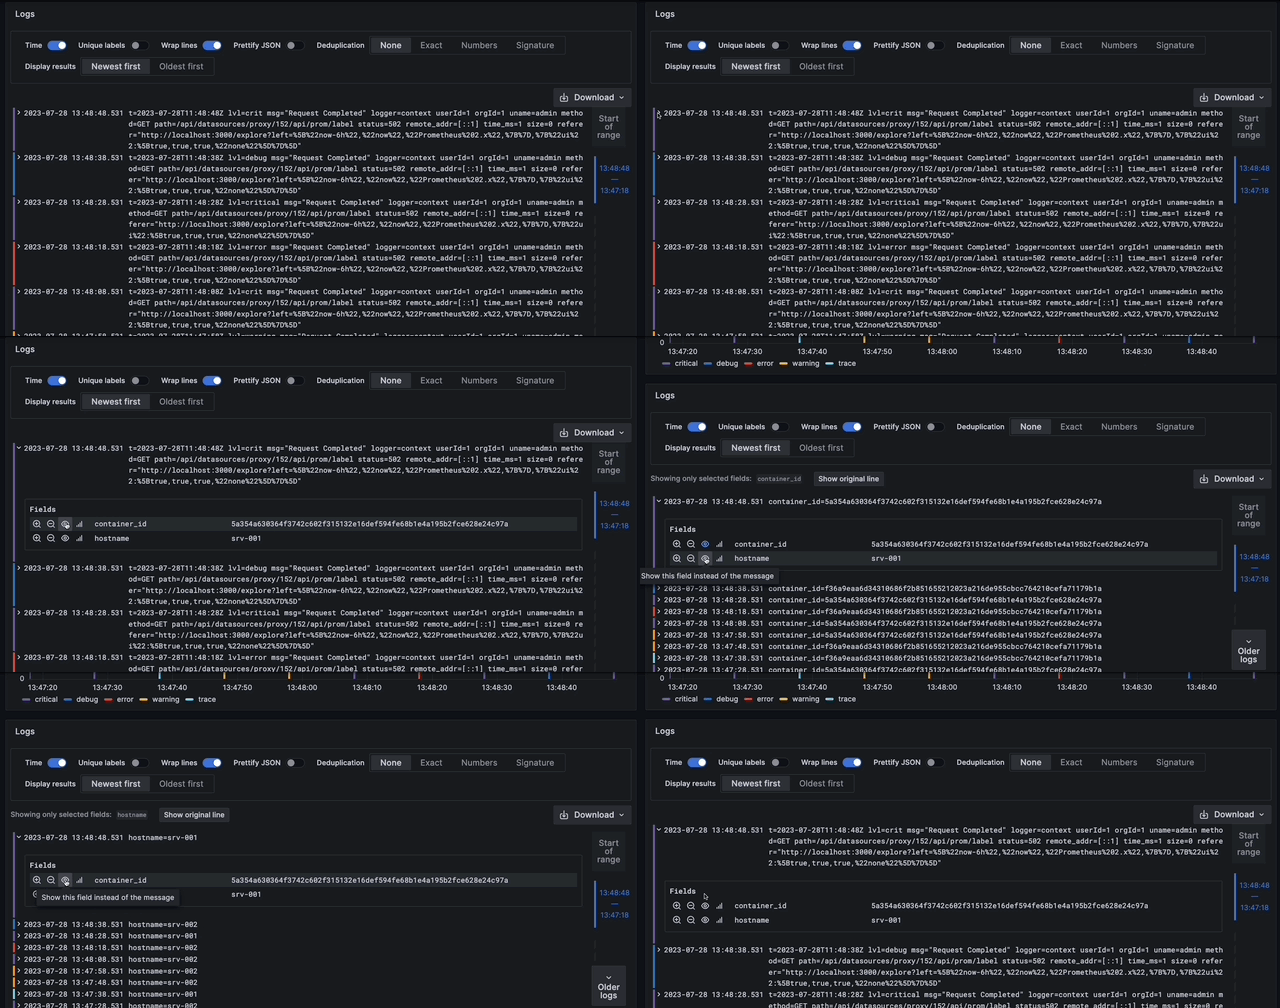
When you’re browsing logs in Explore, you can now click the eye icon within a row to replace the log line’s contents with the value of one or more of the log fields or labels. This is helpful for scanning through your logs.
Logs: Improved rendering performance of log lines
Generally available in all editions of Grafana
After a series of performance optimizations to log-related components, browsing log lines is faster than ever.
Logs: See more log lines in log context
Generally available in all editions of Grafana
Log context allows you to view additional lines surrounding a specific log entry. With this enhancement, you can access as many log lines as needed within the log context. As you scroll through the logs, Grafana dynamically loads more log lines, ensuring a seamless and continuous viewing experience.
Elasticsearch logs sample
Generally available in all editions of Grafana
For Elasticsearch metric queries in Explore, you can now see the sample of log lines that contributed to the displayed results. To see these logs, click the collapsed logs sample panel under your graph or table panel. If you want to interact with the log lines or modify the log query, click the Open logs in split view button and the log query will be executed in the split view.
Panel plugins in Explore
Experimental in all editions of Grafana
Data source plugin developers can now use any plugin to visualize data in Explore. Similar to preferredVisualizationType, we’ve introduced an experimental API to render visualizations by plugin ID. In the returned data frame, set the meta option preferredVisualisationPluginId to the plugin ID you want to be used when showing the data for given data frame.
Alerting
All Alerting features are generally available in all editions of Grafana
We’ve made a number of improvements to simplify the alert rule creation process as well as improvements to contact points and alert management. For all the details, refer to our Alerting documentation.
Alert rules
We’ve made the following changes to alert rules.
Alert instance routing preview
This feature is for Grafana-managed alert rules only.
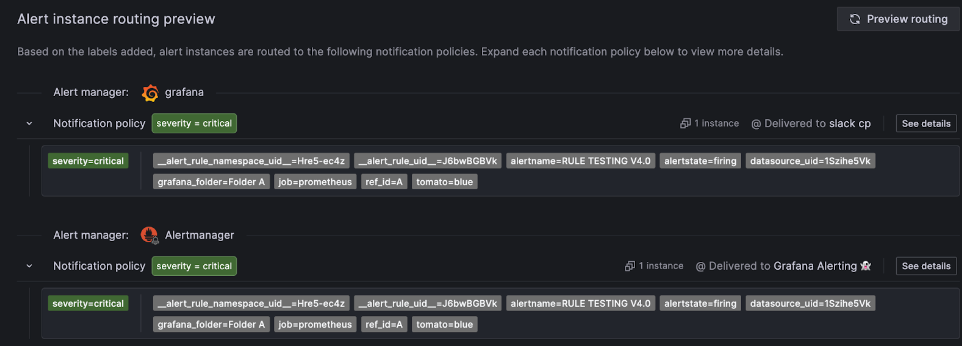
Preview how your alert instances will be routed if they fire while you’re creating your alert rule. You can view routing for each Alertmanager you’ve configured to receive Grafana-managed alerts, and if required, easily make adjustments to your custom labels to change the way your alert instances are routed.
Alert rule types
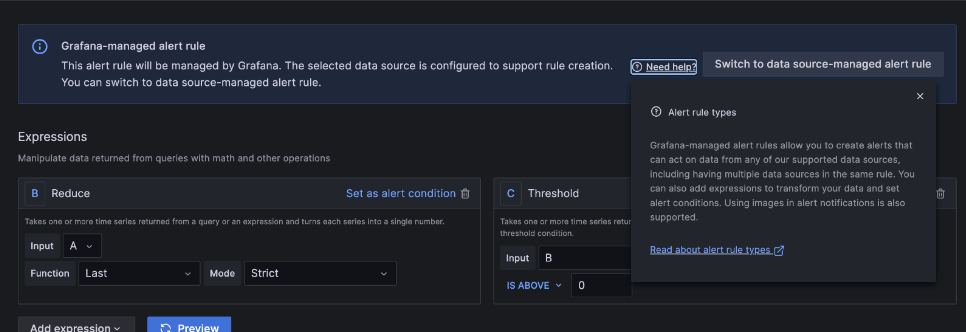
You can switch to a data source-managed alert rule if your data source is configured to support alert rule creation (Ruler API enabled). By default, the alert rule type is Grafana-managed.
UI improvements
- Alert evaluation behavior: New UI components for creating a folder and adding an evaluation group. along with improved text and validation.
- Alert Rule list page: The process of creating recording rules (More drop-down) is now separate from Grafana-managed and data source-managed alert rules (+New alert rule) .
- Annotations display: Adding a summary, description, and runbook URL as annotations are now optional. The dashboard and panel names are now also linked directly, making them easier to access.
- View YAML button: Displays alert rule configuration in YAML format on the Grafana-managed alert rules form, as well as in the Grafana-managed provisioned and non-provisioned Alert Rule detail view.
- Queries and expressions: Several improvements have been made to the display of queries and expressions, including making Add expression a drop-down and moving Conditions to the header.
- Min interval option: Improves control over query costs and performance by allowing you to adjust the minimum resolution of the data used in your alerting queries.
- In-app guidance for alert rule creation: Learn about how to create your alert rules interactively with in-app guidance for additional context and links out to our Alerting documentation.
- Support for toggling common labels: Toggle between showing or hiding labels for each individual alert instance.
Contact points
We’ve made the following changes to contact points.
Additional contact points for external Alertmanager
We’ve added support for the following contact points when using an external Alertmanager:
- Amazon SNS
- Telegram
- Cisco Webex Teams
Contact point provisioning file export
This update facilitates file provisioning and maintenance for contact points. The feature implements the provisioning API export endpoints for exporting contact points as well as adding export buttons to the contact point list in the UI.
Notification policies
We’ve made the following changes to notification policies.
Notification policy provisioning file export
This update facilitates file provisioning and maintenance for notification policies. The feature implements the provisioning API export endpoints for exporting notification policies as well as adding an export button to the root notification policy in the UI.
Alert management
We’ve made the following changes to alert management.
Support for time zones in mute timings
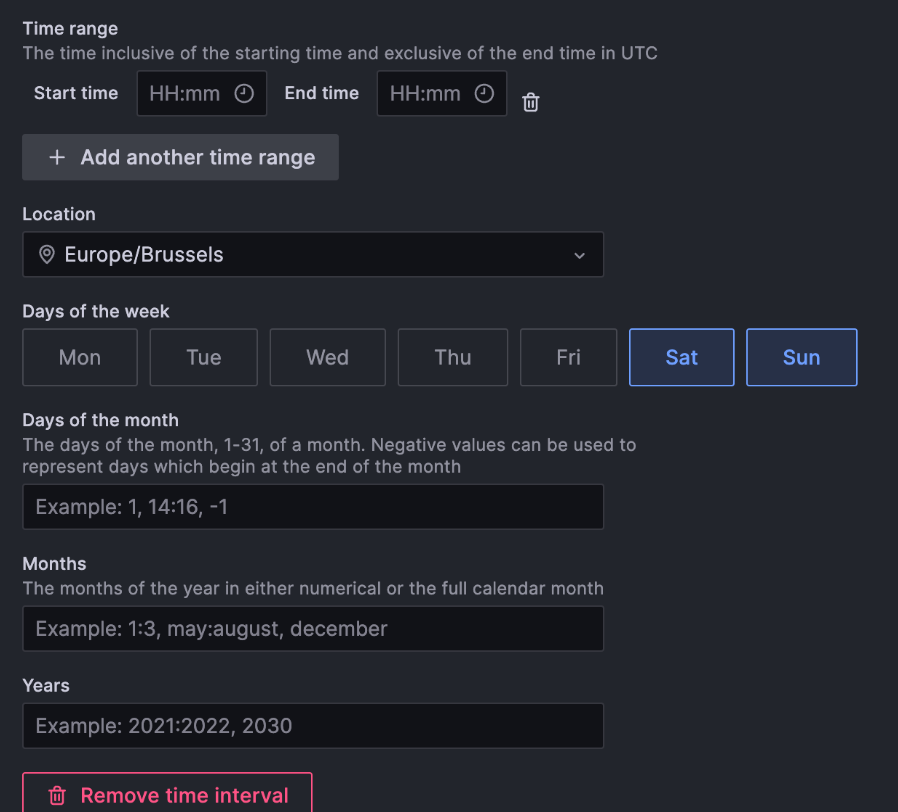
We’ve added support for different time zones and locations as well as a visual selector for week days, made improvements to loading and error handling, and provided better validation for time ranges.
Label colors for alert instances
Labels are colored according to the label key, which makes it easier to track and view labels across alert instances.
Authentication and authorization
OAuth role mapping enforcement
Generally available in all editions of Grafana
This change impacts GitHub, GitLab, Okta, and Generic OAuth.
Previously, if no organization role mapping was found for a user when they connected using OAuth, Grafana didn’t update the user’s organization role.
Now, on every login, if the role_attribute_path property doesn’t return a role, then the user is assigned the role specified by the auto_assign_org_role option or the default role for the organization, which is Viewer by default.
To avoid overriding manually set roles, enable the skip_org_role_sync option in the Grafana configuration for your OAuth provider before affected users log in for the first time.
Prevent manual role updates for externally synced roles
Generally available in all editions of Grafana
This change impacts all instances that use an external authentication provider and have role mapping enabled.
Previously, it was possible to manually update a user’s organization role (Viewer, Editor, Admin, or Grafana Admin) even if this role was managed by an external authentication provider.
This means that roles could be manually set for the duration of a user’s session, but were overridden by the external authentication provider the next time the user logged in.
If the onlyExternalOrgRoleSync feature toggle was enabled, only then were manual role updates for externally managed roles not allowed.
Now, you can no longer manually update externally managed organization roles.
We’ve removed the onlyExternalOrgRoleSync feature toggle, and have defaulted to locking the organization role of users authenticated by an external provider.
If you prefer to manage your users’ organization roles manually, enable the skip_org_role_sync option in the Grafana configuration for your authentication provider.
For context on the previous work done leading up to this change, refer to the Grafana v9.5 What’s new.
GitLab OIDC support
Generally available in all editions of Grafana
Grafana now supports GitLab OIDC through the GitLab OAuth provider in addition to the existing GitLab OAuth2 provider. This allows you to use GitLab OIDC to authenticate users in Grafana.
This change also allows Grafana to reduce the access scope to only the required scopes for authentication and authorization, instead of full read API access.
To learn how to migrate your GitLab OAuth2 setup to OIDC, refer to our GitLab authentication documentation.
Google OIDC and Team Sync support
Generally available in all editions of Grafana
Grafana now supports Google OIDC through the Google OAuth provider in addition to the existing Google OAuth2 provider. This allows you to use Google OIDC to authenticate users in Grafana, which in turn, lets Grafana reduce the access scope to only the required scopes for authentication and authorization.
This release also adds support for Google OIDC in Team Sync. You can now easily add users to teams by using their Google groups.
To learn how to migrate your Google OAuth2 setup to OIDC and how to set up Team Sync, refer to our Google authentication documentation.
Plugins
Angular deprecation changes
Generally available in all editions of Grafana
We’ve made the following updates to increase awareness of the Angular deprecation and its consequences in future releases of Grafana:
UI changes
- Added an Angular badge next to affected plugins in the plugins catalog.
- Added an alert at the top of a plugin’s page in the plugins catalog when browsing Angular plugins.
- Added an alert at the top of the query editor when editing panels that use Angular data source plugins.
Other changes
- Angular Plugins will not be loaded if angular_support_enabled is set to
false.
Learn more in our Angular support deprecation documentation.
Deprecated provisioning of data sources with invalid UIDs
Generally available in all editions of Grafana
Grafana now logs an error when provisioning data sources with invalid UIDs. A valid UID is a combination of a-z, A-Z, 0-9 (alphanumericals), - (dashes), and _ (underscores), with a maximum length of 40 characters.
Provisioning data sources with invalid UIDs will be removed in future versions of Grafana, and will return an error instead.
Subfolders: folder selection
Available in public preview in all editions of Grafana
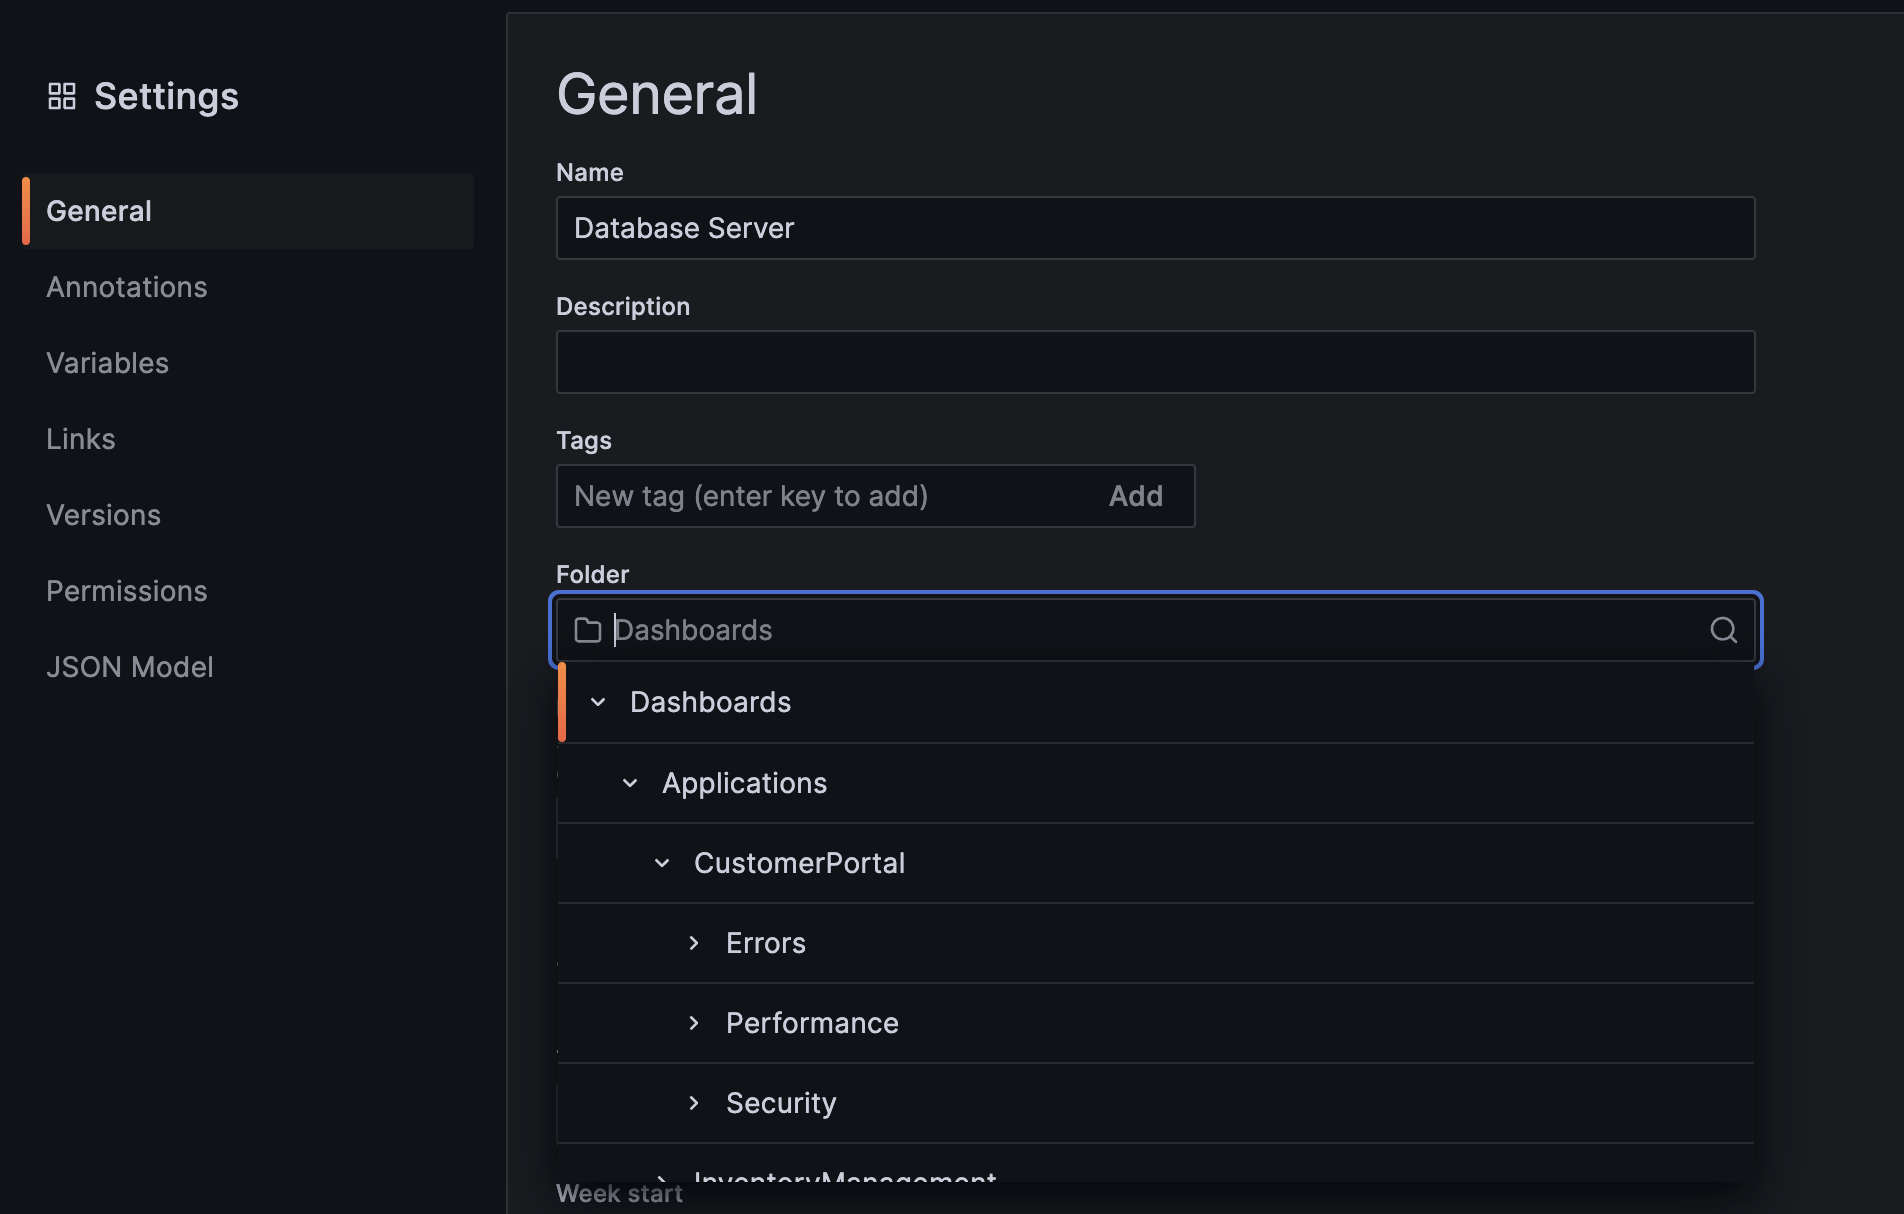
When saving or moving a dashboard, you can now see the full folder tree when selecting the destination folder.
To get started creating subfolders, enable the nestedFolders feature toggle. We recommend that you enable this feature only on test or development instances, rather than in production environments.
