Important: This documentation is about an older version. It's relevant only to the release noted, many of the features and functions have been updated or replaced. Please view the current version.
What’s new in Grafana v10.0
Welcome to Grafana 10.0! Read on to learn about changes to search and navigation, dashboards and visualizations, and security and authentication.
For even more detail about all the changes in this release, refer to the changelog. For the specific steps we recommend when you upgrade to v10.0, check out our Upgrade Guide.
Breaking changes
For Grafana v10.0, we’ve also provided a list of breaking changes to help you upgrade with greater confidence. For information about these along with guidance on how to proceed, refer to Breaking changes in Grafana v10.0.
Correlations
Available in public preview in all editions of Grafana.
You can now bring context from multiple data sources into the Explore experience. Correlations is an extension of our existing data links functionality and now enables you to link from any data source to any other data source.
Correlations enable you to seamlessly jump from one data source to another. You define relationships between your different data sources; when you’re using Explore, simply click a button next to a related field in one data source and Grafana will run the corresponding query in the other data source.
Correlations is currently in preview. As such, we recommended you only enable it on test or development instances, rather than in production environments.
To try out Correlations, enable the correlations feature toggle. If you’re using Grafana Cloud and would like to enable this feature, please contact customer support.
In subsequent releases, we’ll be refining and enhancing the user interface for Correlations, to provide a more streamlined user experience.
Scenes
Available in public preview in all editions of Grafana.
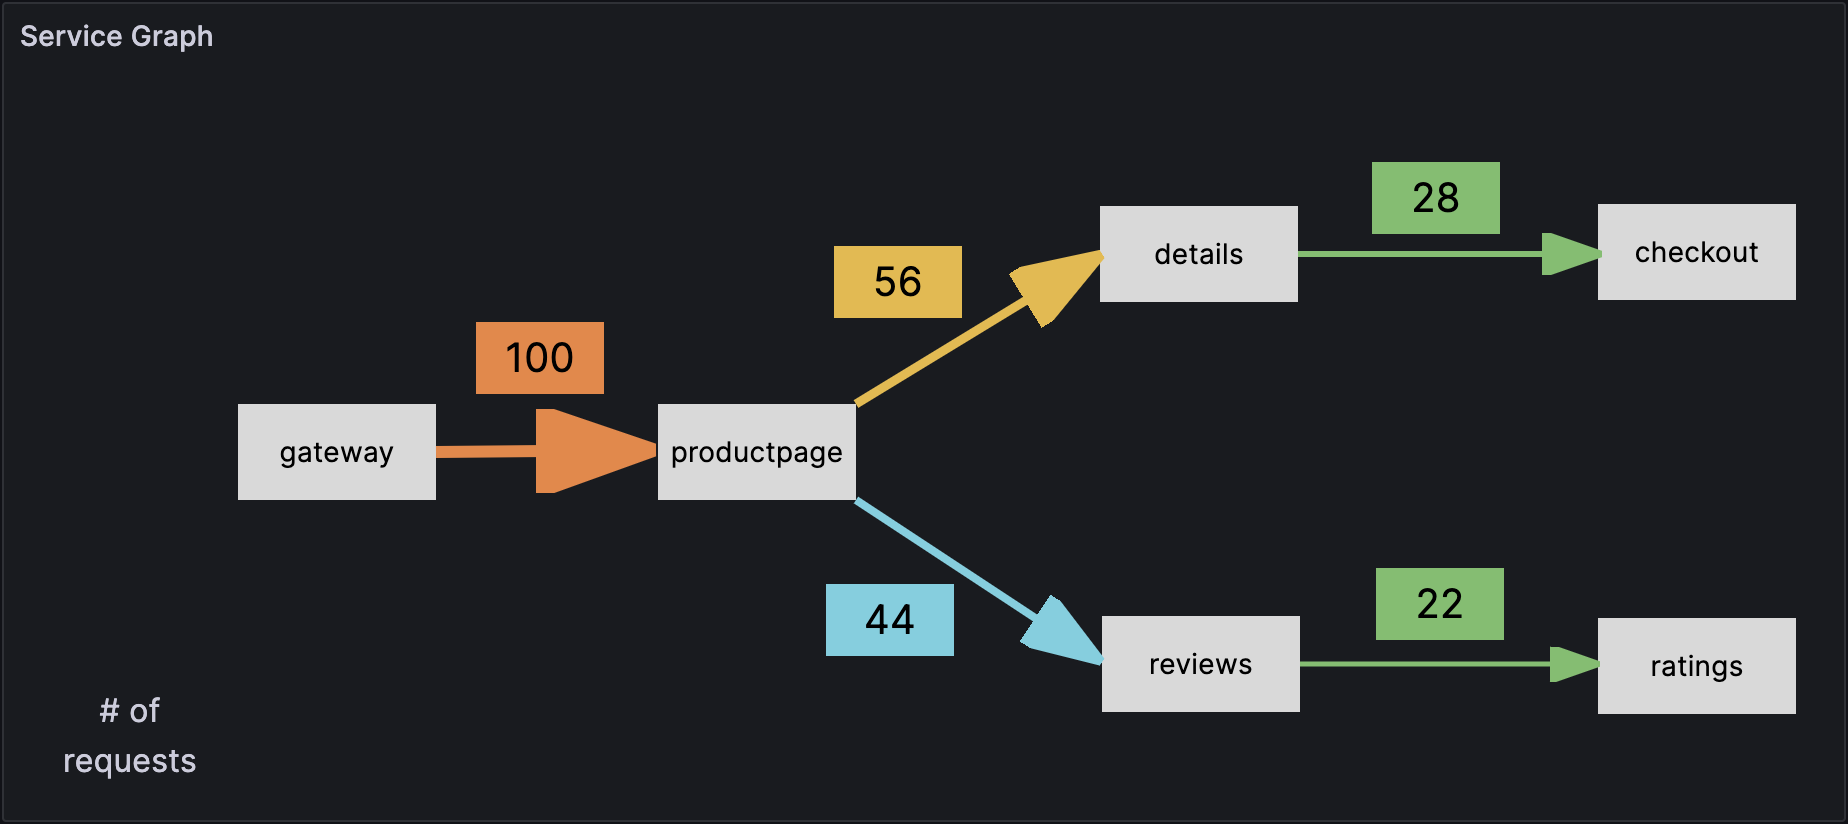
Scenes is a new front-end library by Grafana that empowers Grafana plugin developers to effortlessly build stunning dashboard-like experiences into their Grafana app plugins. With Scenes, you can easily create apps that mirror the Grafana dashboarding experience, complete with template variable support, flexible layouts, dynamic panel rendering, and so much more.
To try it out, go to the @grafana/scenes repository.
To learn more, refer to the Scenes documentation.
Subfolders
Available in public preview in all editions of Grafana.
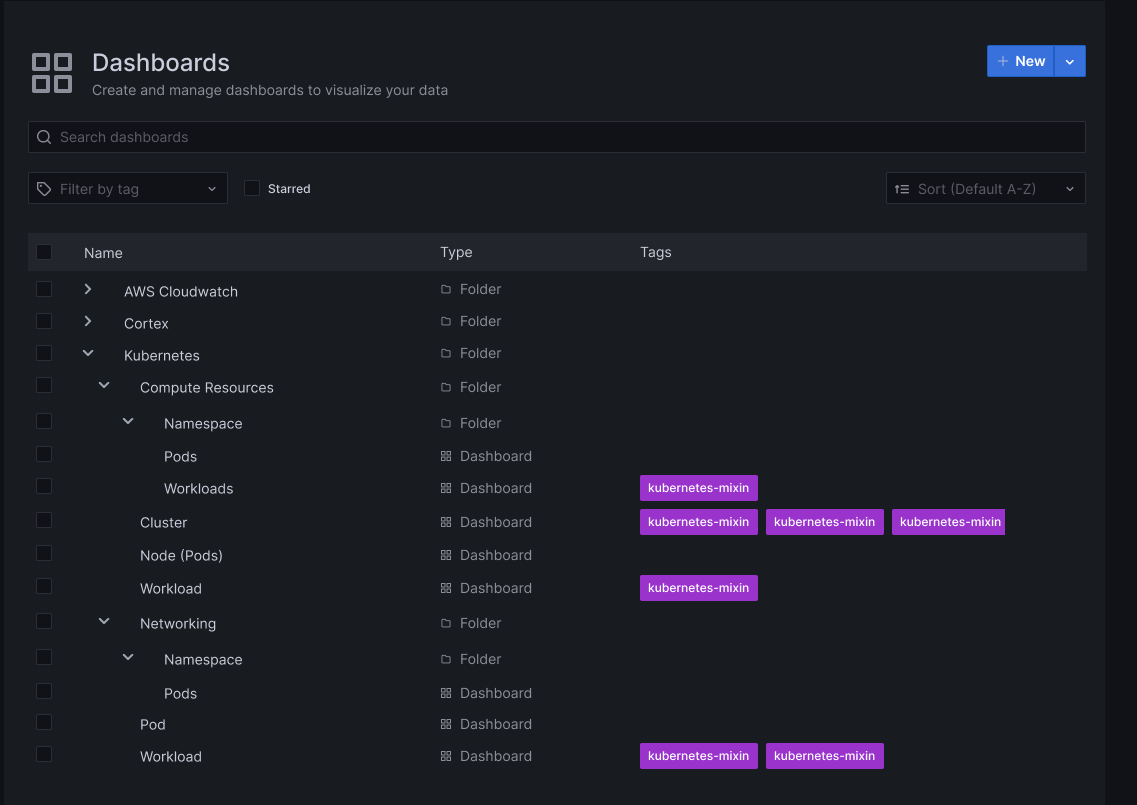
You can now try out creating subfolders in Grafana for organizing your dashboards and alerts. You can enable this new feature in your development environment to create, read, update, and delete subfolders, making it easier to sort resources by business units, departments, and teams.
You can also set up permissions using Role-Based Access Control (RBAC). Folder permissions cascade, being inherited from the parent folder, which simplifies access management.
The ability to add subfolders is currently in preview, with more functionality coming in subsequent releases. This includes creating subfolders using Terraform, and displaying the full folder tree when creating and moving resources through Grafana’s UI. We recommend that you enable this feature only on test or development instances, rather than in production environments.
To get started creating subfolders, enable the nestedFolders feature toggle. If you’re using Grafana Cloud, and would like to enable this feature, please contact customer support.
Dashboards and visualizations
The Canvas panel is GA
Generally available in all editions of Grafana.
We’re promoting the canvas panel out of public preview and into general availability. Over the past several months we’ve introduced multiple enhancements to the panel such as the ability to draw connections between elements, the ability to set the color and size of connections based on data, and the ability to add data links. We’re excited to include Canvas as a first class citizen in Grafana’s core panel library. To learn more about the panel, refer to our Canvas documentation. Also, check out our latest blog post about canvas.
New Trend Panel
Experimental in all editions of Grafana
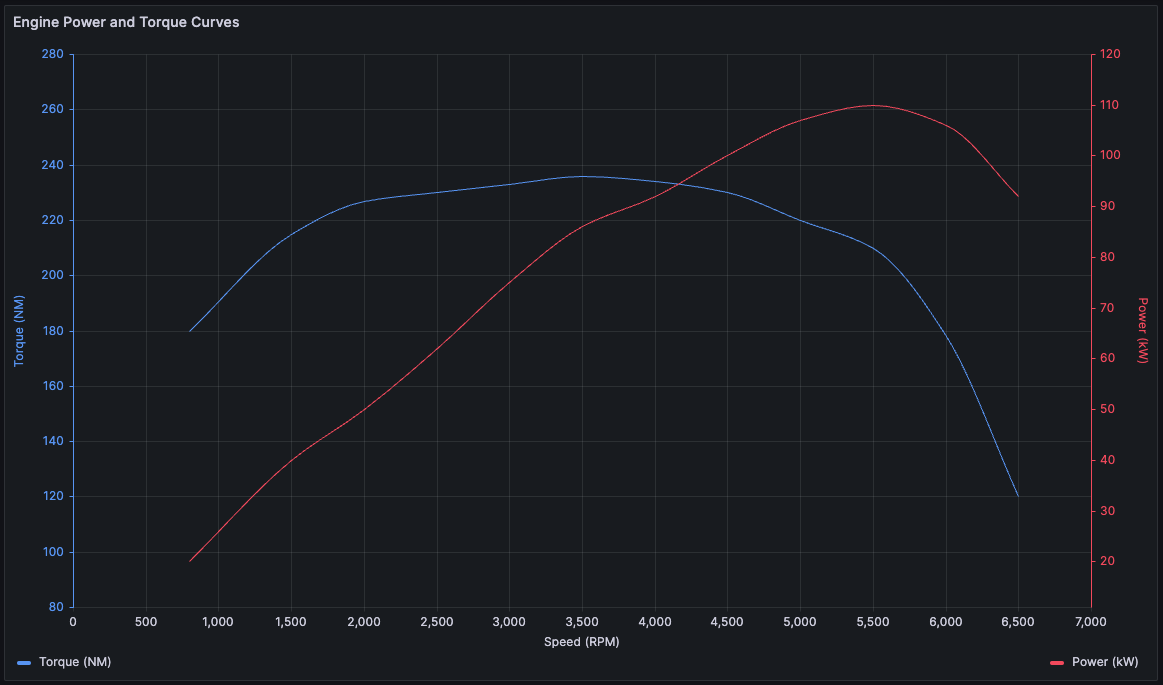
The Trends panel allows you to display trends where the x-axis is numeric and not time. This experimental panel addresses gaps that were not solved by either the Time series or XY Chart panels. For example, you can plot function graphs, rpm/torque curves, supply/demand relationships, and more. To learn more about the Trend panel, refer to the Trend documentation.
New Datagrid panel
Experimental in all editions of Grafana
Datagrid is a new panel that allows you to edit your data within a Grafana dashboard. Imagine having a spreadsheet-like view where you can fine-tune data pulled from a data source or create your own dataset from scratch and use it within your dashboard to update your panels in real time. That’s what Datagrid provides. You can also use the Datagrid panel as a data source used by other panels to augment other data.
To use this new panel editing functionality, enable the enableDatagridEditing feature toggle.
Currently, the Datagrid Panel supports the following features in Grafana version 10.0:
- Creating and deleting rows and columns
- Data and column header edit or delete
- Search functionality
- Column freezing
- Grid selection actions (copy/paste/delete)
- Draggable columns and rows
- Series selection when pulling data from a data source
To learn more, refer to the Datagrid documentation.
In subsequent releases, we’ll continue adding features to the Datagrid panel to further improve the user experience.
Drag and drop spreadsheets into Grafana
Experimental in all editions of Grafana
It’s easier than ever to view local data in Grafana: introducing drag and drop. The drag and drop functionality allows you to upload your csv, Excel, or numbers files by simply dragging and dropping them into the query editor of the Grafana data source.
To try out drag and drop, enable the editPanelCSVDragAndDrop feature toggle.
As of Grafana version 10.0, drag and drop supports the following scenarios:
- Drag and drop files into the panel editor
- Replace files in the panel editor
- Default table panel creation
The data from dragged and dropped files is stored in the dashboard JSON and file size is limited to 1MB. To learn more about drag and drop functionality, refer to the official documentation.
Select data sources more easily
Generally available in all editions of Grafana.
Concepts like data sources and dashboard panels are hard to grasp and it can be a struggle to go from Grafana’s “empty state” to a working dashboard that displays data. Our latest advancements streamline the process of selecting the ideal data source in Grafana, prioritizing recent usage, and providing labels and supplementary descriptions.
With this flow, selecting a data source has been greatly simplified, providing a clear overview of available data sources and allowing you to quickly connect to a new one when needed.
Time series time region support
Generally available in all editions of Grafana.
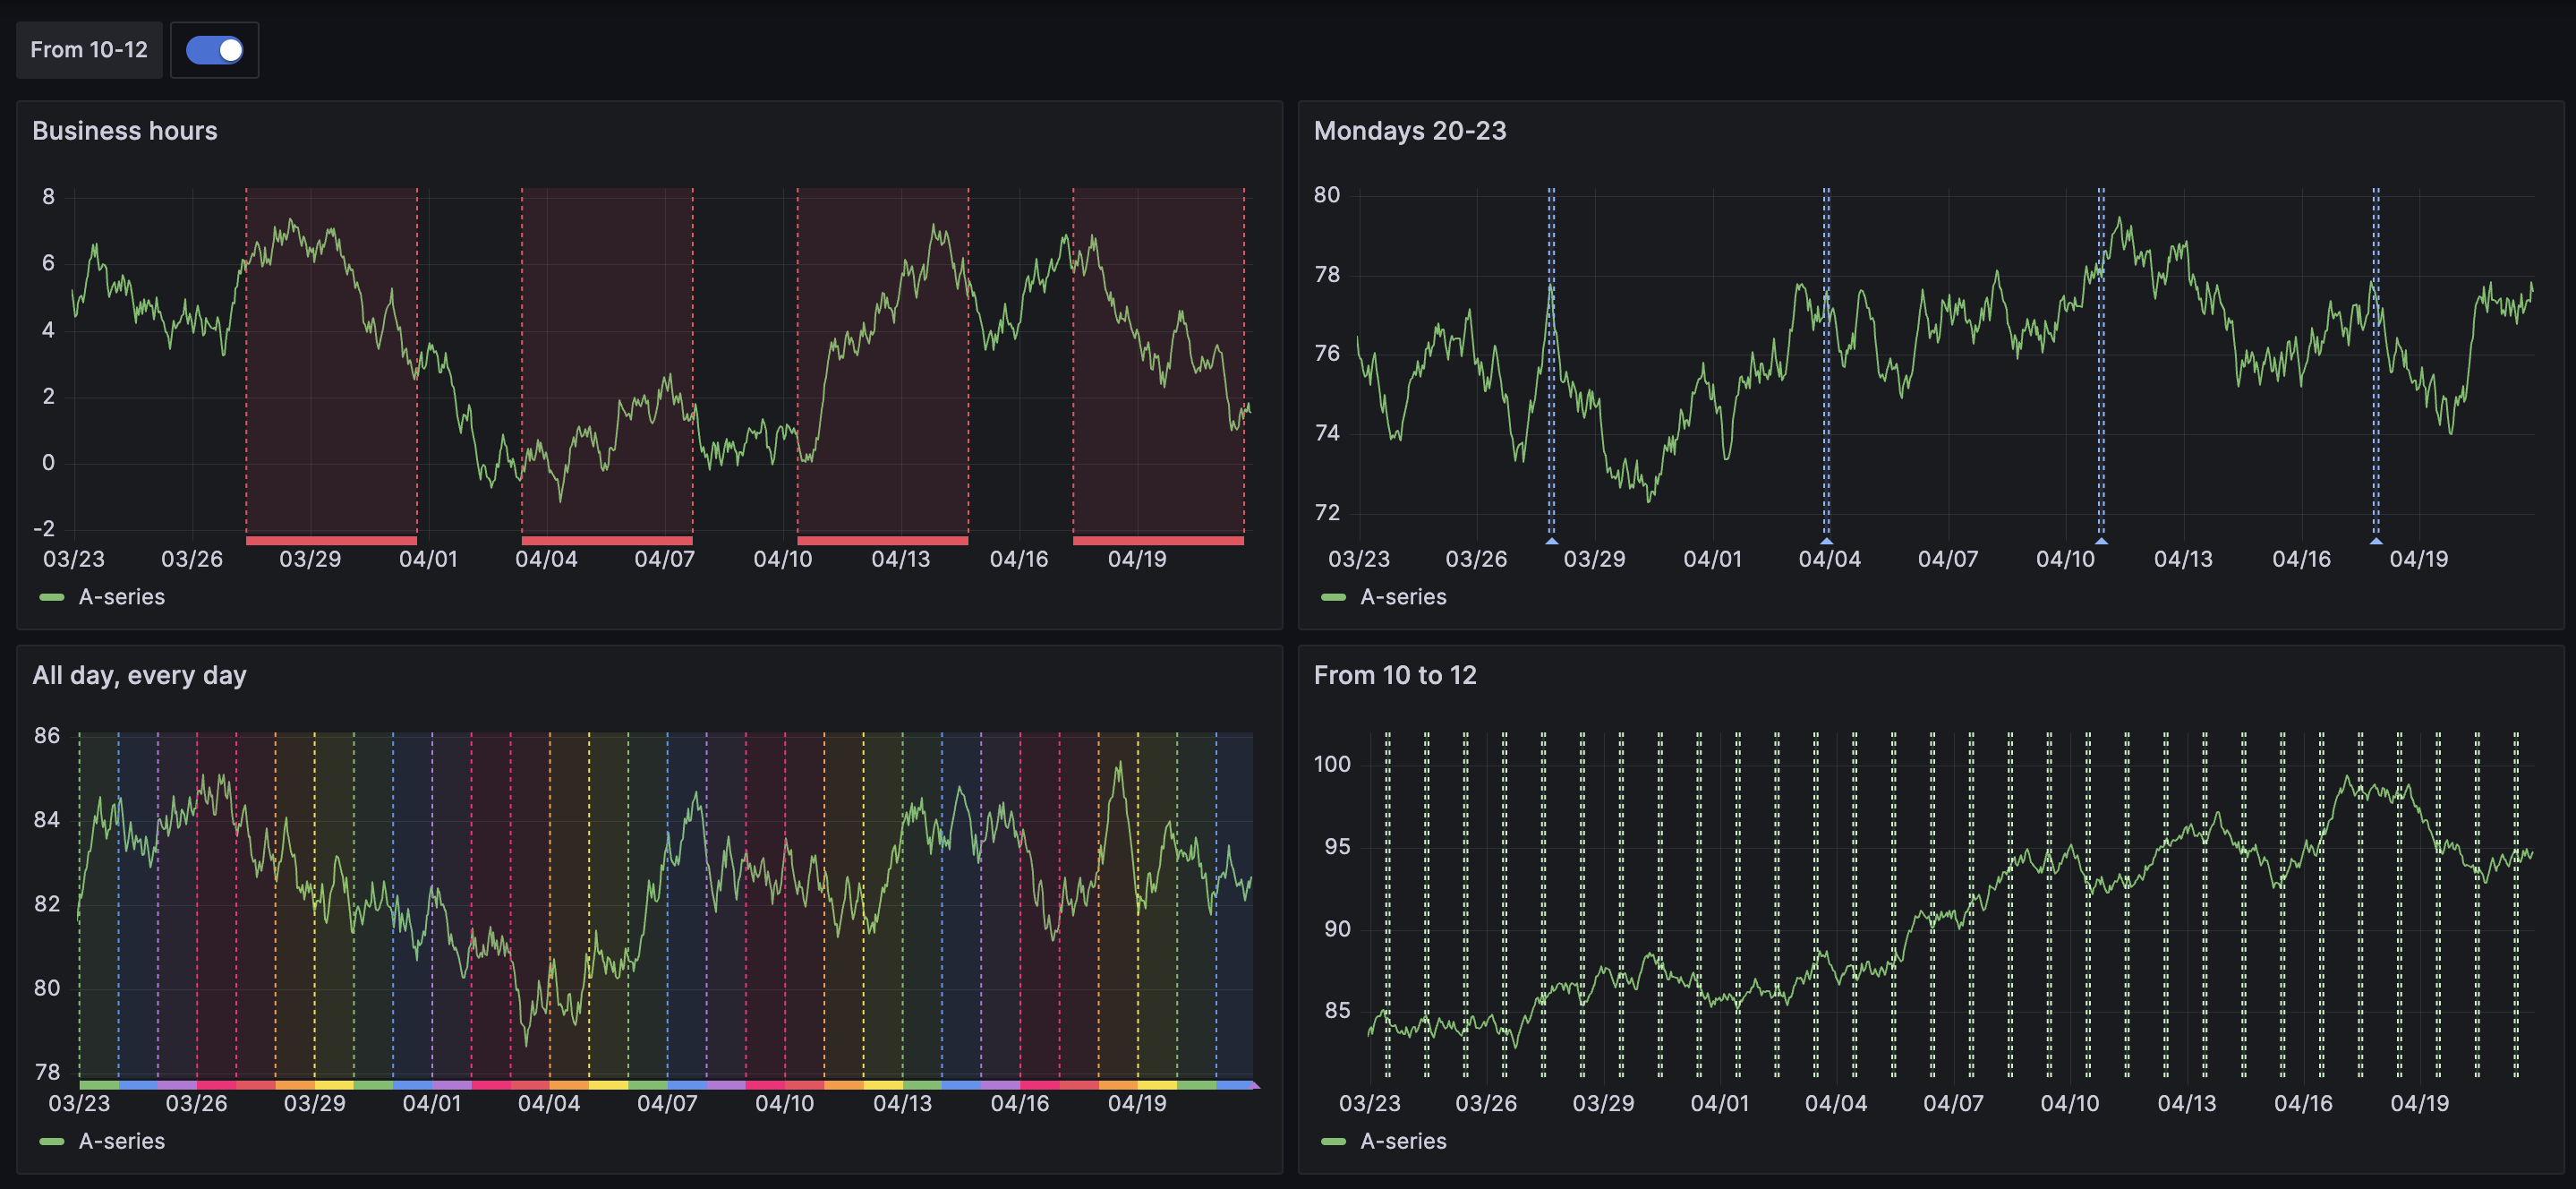
We’ve implemented support for adding time regions to the Time series panel. Time regions provide a more contextualized experience, enabling you to highlight certain days of the week, such as Monday to Friday to display work weeks, right alongside your data. Time regions are also a useful way to highlight specific parts of a day like night, work hours, or whatever you want to define for each day. They allow you to quickly orient yourself in parts of the day or ignore highlighted parts of the time series.
To learn more, refer to our time region documentation.
Annotation filtering
Generally available in all editions of Grafana.
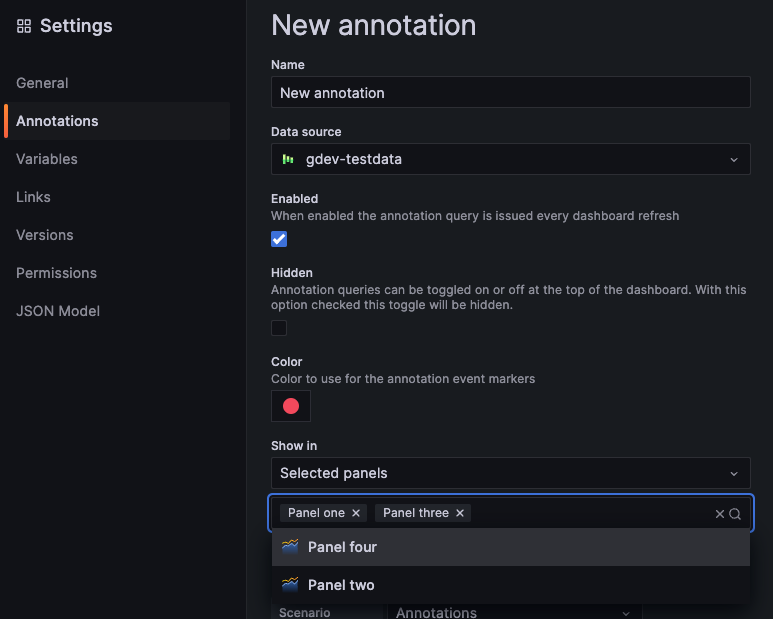
You can now filter dashboard annotations to apply annotations to all panels or selected panels, or use them to exclude selected panels.
To learn more, refer to our documentation about adding annotation queries.
Redesigned and improved log context
Generally available in all editions of Grafana.
We’ve made enhancements to Grafana’s log context feature, resulting in a more seamless and consistent user experience. With the updated user interface, you can expect the same level of functionality and usability in log context as you would in any other logs panel.
Notably, we’ve added the following new features that streamline the log context experience:
- Log details with actions, including a Copy button, to easily copy lines, and an eye icon to display only selected labels, allowing you to focus on specific information without leaving the log context section.
- A Wrap Lines toggle to automatically wrap long lines of text for easier reading and analysis of log entry context directly in log context.
- An Open in split view button to execute the context query for a log entry in a split screen in Explore.
- Only for Loki: A quick-filter menu that lets you easily refine the context query by selecting and removing labels.
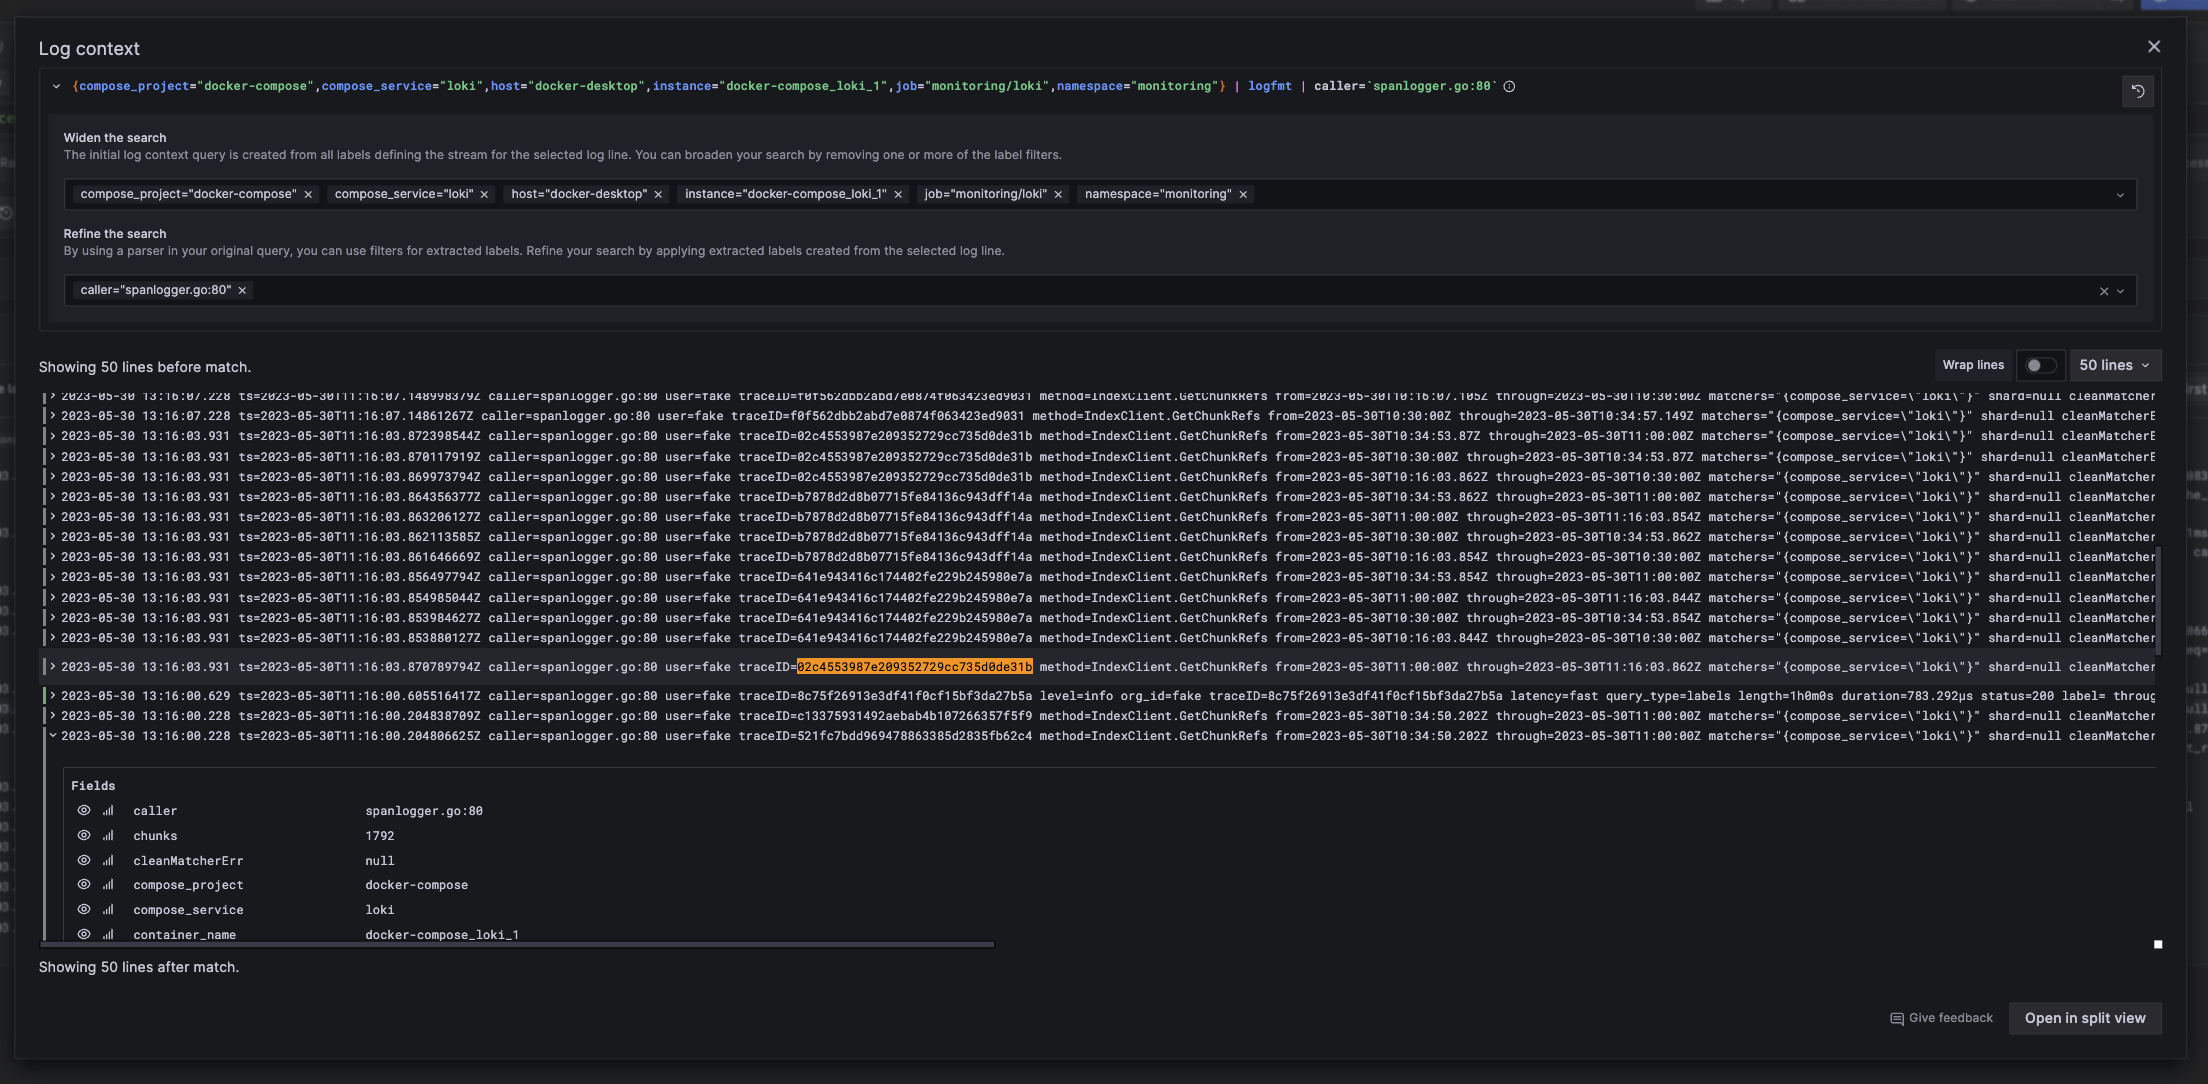
These improvements make working with log context in Grafana more intuitive and efficient, ultimately improving the overall user experience.
Query multiple data sources in Explore
Generally available in all editions of Grafana.
You can now query multiple data sources simultaneously in Explore. Select “Mixed” from the data source picker and specify a data source for each query.
If you’re using Grafana Open Source or Enterprise, you can disable this feature using the exploreMixedDatasource feature toggle.
Public dashboards
Available in public preview in all editions of Grafana.
Public dashboards allow you to share your Grafana dashboard with anyone without requiring them to log in to Grafana. This is useful when you want to make your dashboard available to the world.
With this update, we’ve made the following improvements:
- The time picker and annotations can be toggled on or off in public dashboard configuration.
- You can see a list of all your public dashboards in Dashboards > Public dashboards.
- The user interface has been improved with a new modal design, as well as paused and not found pages.
- Added support for collapsed rows, hidden queries, and zoom into panels.
To try it out, enable the publicDashboards feature toggle. If you’re using Grafana Cloud, and would like to enable this feature, please contact customer support.
To learn more, refer to our public dashboards documentation.
Public dashboards insights
Available in public preview in Grafana Enterprise, Cloud Pro, and Cloud Advanced.
Public dashboards insights provide valuable information about your public dashboard usage. You can easily access and view important metrics such as the daily query count, the number of views in the last 30 days, and the number of errors in the last 30 days.
To try it out, enable the publicDashboards feature toggle. If you’re using Grafana Cloud, and would like to enable this feature, please contact customer support.
Email sharing for public dashboards
Available in public preview in Cloud Pro and Cloud Advanced.
Our email sharing feature allows you to easily share your public dashboards and make them visible only with specific individuals. When you add their email addresses, they receive a one-time link to access the dashboard. This provides you with greater control over who can view your public dashboards.
We’ve also added a Public dashboard users tab in Administration > Users where you can view a list of users who have accessed your public dashboards by way of email sharing.
To try it out, please contact customer support.
Note
This feature will have a cost by active users after being promoted into general availability.
To learn more, refer to our public dashboards documentation.
Authentication and authorization
Configure your SAML provider in the Grafana UI
Generally available in Grafana Enterprise, Cloud Pro, and Cloud Advanced.
You can now configure SAML using our new user interface, making the process easier and more convenient than ever before. With the new user interface (UI), you can now configure SAML without needing to restart Grafana and you can control access to the configuration UI by using role-based access control (RBAC), which makes the process much faster and more efficient.
The SAML UI is available in Grafana Enterprise, Cloud Pro, and Advanced. It’s user-friendly, with clear instructions and helpful prompts to guide you through the process.
For more information on how to set up SAML using the Grafana UI, refer to Configure SAML authentication using the Grafana user interface.
Case-insensitive usernames and email addresses
Generally available in all editions of Grafana.
Usernames and email addresses are now treated as case-insensitive, which means that you no longer need to worry about capitalization when logging in or creating an account.
From now on, whether you type your username or email address in uppercase, lowercase, or a combination of both, Grafana will treat them as the same. This simplifies the login process and reduces the risk of typos and identity conflicts when changing authentication providers.
To help you deal with potential user identity conflicts, we’ve built a Grafana CLI user identity conflict resolver tool, which is available from Grafana version 9.3.
Note
If you’re running Grafana with MySQL as a database, this change doesn’t have any impact as MySQL users were already treated as case-insensitive.
Tracing
Span filtering for traces
Available in public preview in Grafana Cloud Free, Cloud Pro, and Cloud Advanced.
You can now work much more efficiently with traces that consist of a large number of spans with span filtering.
Span filters exist above the trace view and allow you to filter the spans that are shown in the trace view. The more filters you add, the more specifically span are filtered.
Currently, you can add one or more of the following filters:
- Service name
- Span name
- Duration
- Tags (which include tags, process tags, and log fields)
Span filtering is currently in preview. As such, it’s recommended to enable it only on test or development instances, rather than in production environments.
To try it out, enable the newTraceViewHeader feature toggle. This feature is enabled by default in Grafana Cloud.
OpenTelemetry replacing OpenTracing
Generally available in all editions of Grafana.
We’ve started the work to migrate to OpenTelemetry in Grafana version 8.4; now we’re removing OpenTracing and, for those who still have it configured, replacing it under the hood with OpenTelemetry. These changes are backwards compatible, so you don’t need to change anything and the feature will continue working as it did before.
Data sources
Azure Monitor data source
Generally available in all editions of Grafana.
The Azure Monitor data source now supports visualizing Application Insights Traces. A new query type, Traces, has been added to the service list. This can be used against Application Insights resources to query and visualize traces in both a tabular format and using the built-in Traces visualization.
This also includes support for a new Azure API that will correlate trace IDs against all Application Insights resources that are accessible to the principal that the data source is configured with. To support this feature, a new query builder has been added with support for querying the Application Insights resource using an Operation ID or visualizing and filtering the data based on the event type and a subset of the properties available on the trace.
Prometheus dashboard performance improvements
Experimental in Grafana Open Source.
The Prometheus data source now supports delta (incremental) querying, in which values from data frames are cached and leveraged to modify future requests to avoid requesting duplicate values in dashboards with now-relative (that is, any dashboard querying until “now”) queries. This feature is disabled by default as it is still experimental, but can be enabled and configured in the Prometheus data source configuration.
This update will reduce network load, and speed up now-relative dashboards, especially for dashboards returning a lot of data.
Phlare renamed to Grafana Pyroscope
Generally available in all editions of Grafana.
We’ve renamed the Phlare data source Grafana Pyroscope data source as part of the ongoing unification of the Phlare and Pyroscope projects. This data source supports both Phlare and Pyroscope backends. Existing instances of the data source should not be affected. When you create a new instance of the data source, the backend type will be autodetected on the configuration page, or you can select it manually.
Data plane
Generally available in all editions of Grafana.
Data types are now being defined to create a data plane layer between producers and consumers of data. By defining data types as part of Grafana’s platform, plugin and application developers can use these data types to achieve more reliable interoperability across the platform.
Learn more:
- Data plane contract - Technical specification
- Example typed dataframes and Go lib to use them in tests
- Go library for reading and writing dataplane data
Alerting
All Alerting features are generally available in all editions of Grafana.
State history view
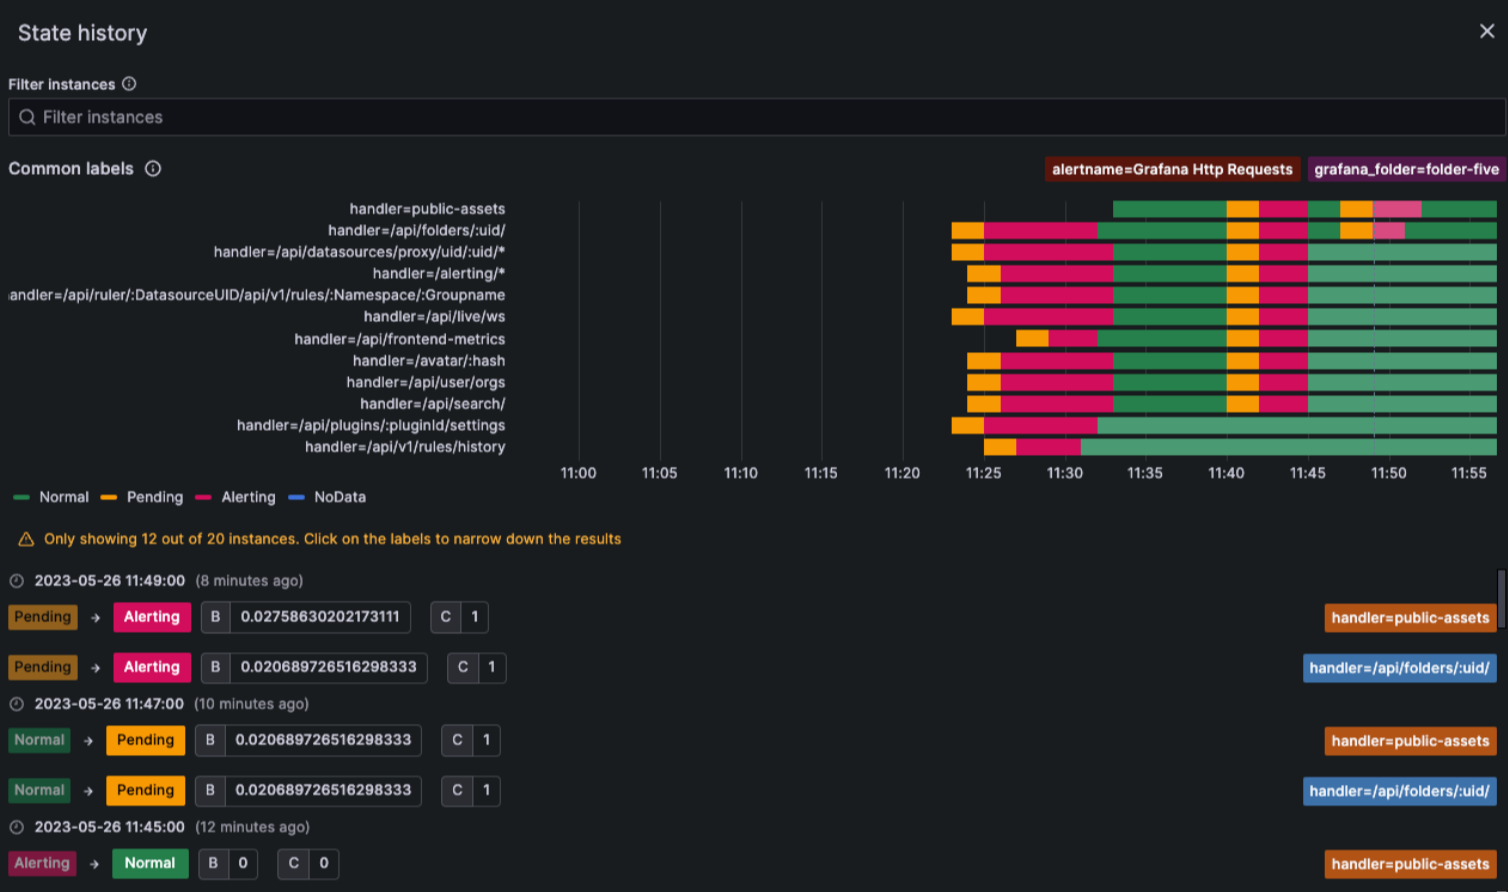
Use the improved State history view to get insight into how your alert instances behave over time. View information on when a state change occurred, what the previous state was, the current state, any other alert instances that changed their state at the same time, as well as what the query value was that triggered the change.
Preview notification templates
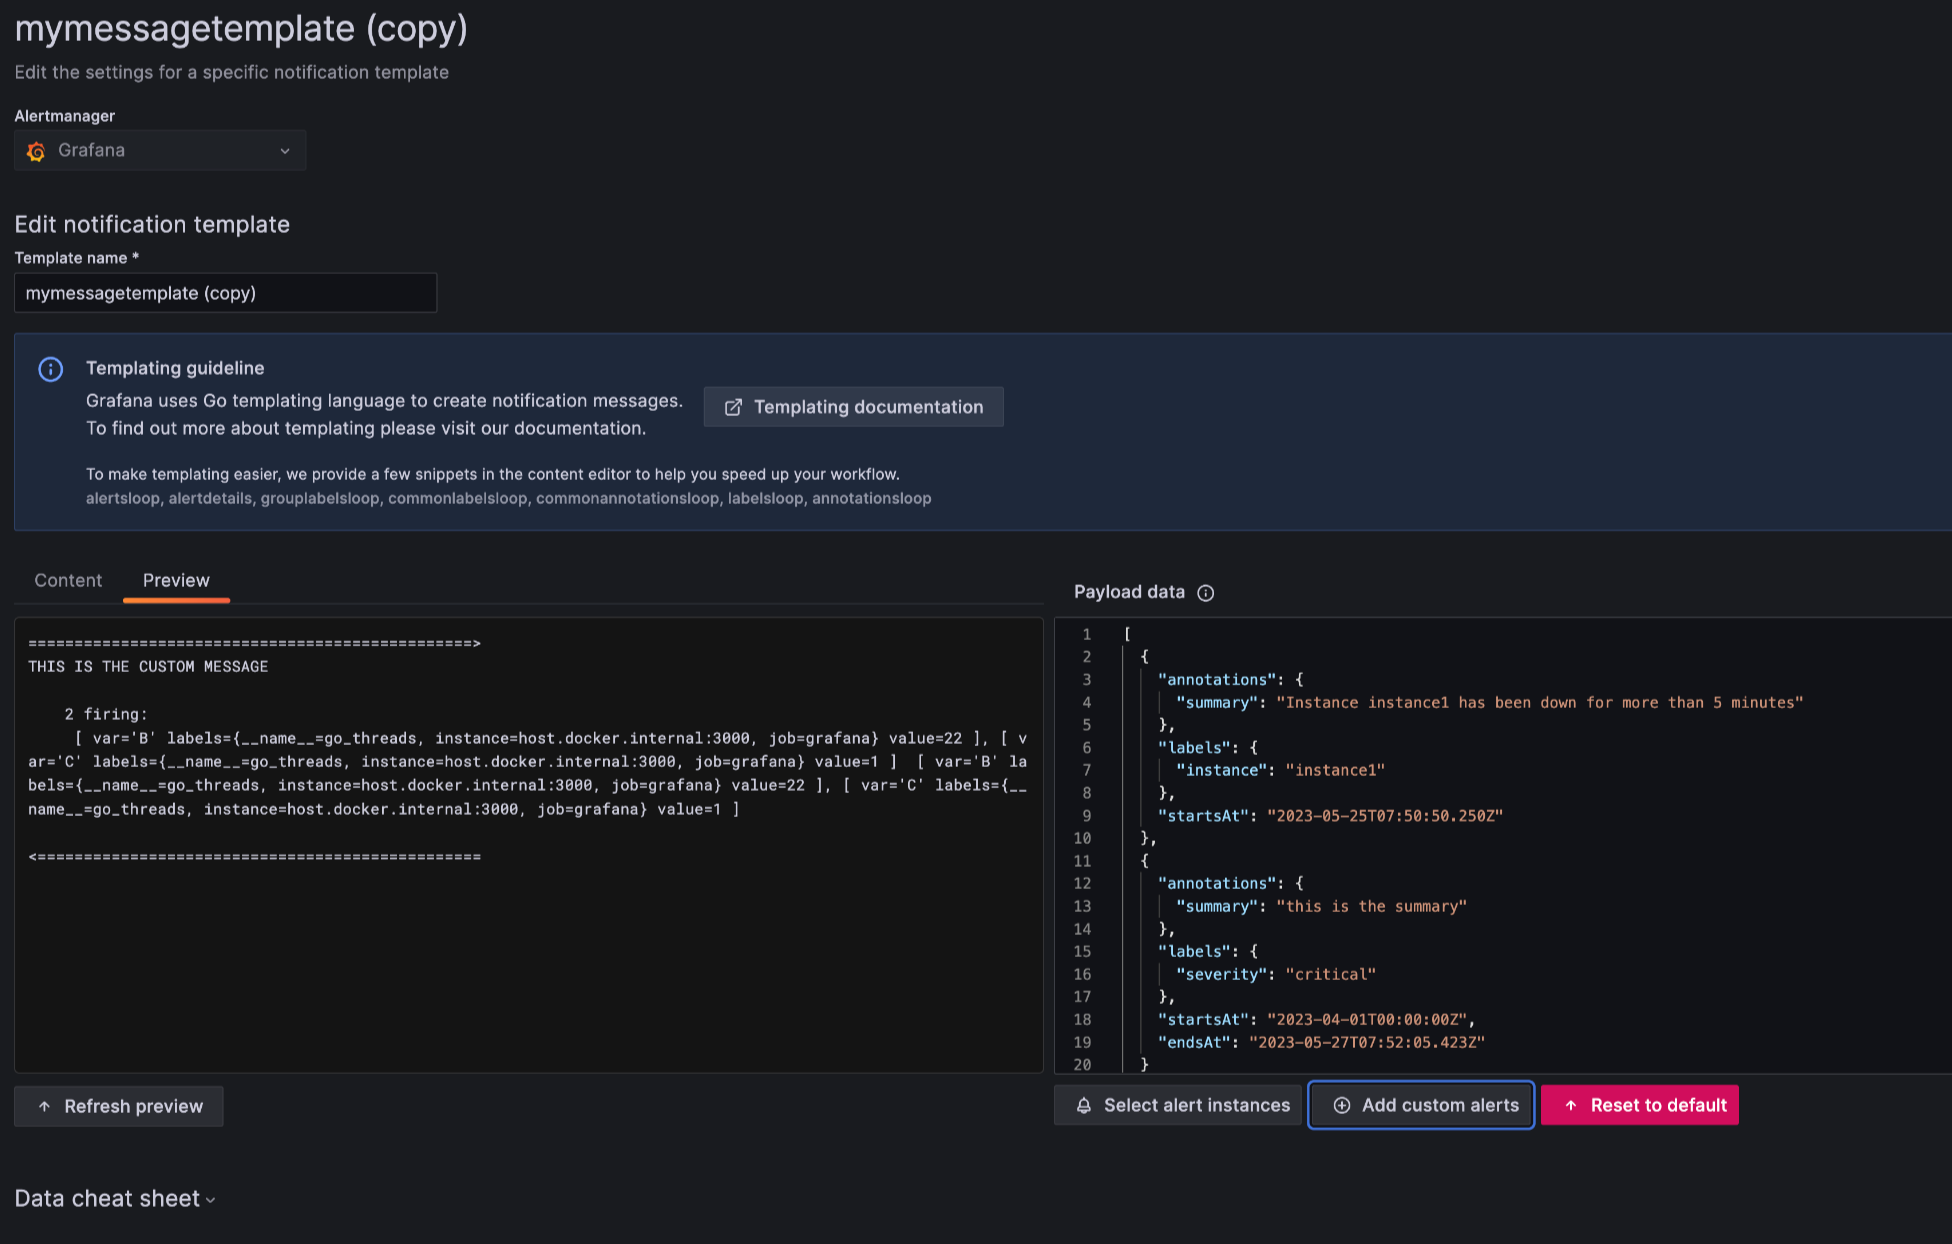
Preview how your notification templates will look before using them in your contact points.
Security
Trusted Types support
Experimental in all editions of Grafana.
Use trusted types to reduce the risk of XSS vulnerabilities, including the sanitization of third party libraries or plugins that have not explicitly performed sanitization.
To use this feature in report-only mode:
- Enable
content_security_policy_report_onlyin the configuration. - Add
require-trusted-types-for 'script';to thecontent_security_policy_report_only_template.
To use it in enforce mode:
- Enable
content_security_policyin the configuration. - Add
require-trusted-types-for 'script';to thecontent_security_policy_template.
This is an experimental web technology with limited browser support.
Private data source connect
Available in public preview in Grafana Cloud Pro and Advanced.
Some data sources, like MySQL databases, Prometheus instances or Elasticsearch clusters, run in private networks, like on premises networks or virtual private clouds (VPCs) running in AWS, GCP, or Azure.
To query these data sources from Grafana Cloud, you’ve had to open your private network to a range of IP addresses, a non-starter for many IT Security teams. The challenge is, how do you connect to your private data from Grafana Cloud, without exposing your network?
The answer is Private Data Source Connect (PDC), available now in public preview in Grafana Cloud Pro and Advanced. PDC uses SOCKS over SSH to establish a secure connection between a lightweight PDC agent you deploy on your network and your Grafana Cloud stack. PDC keeps the network connection totally under your control. It’s easy to set up and manage, uses industry-standard security protocols, and works across public cloud vendors and a wide variety of secure networks. Learn more in our Private data source connect documentation.


