
Menu
Important: This documentation is about an older version. It's relevant only to the release noted, many of the features and functions have been updated or replaced. Please view the current version.
Grafana Cloud
Enterprise
Open source
Dashboard list
Dashboard lists allow you to display dynamic links to other dashboards. The list can be configured to use starred dashboards, recently viewed dashboards, a search query, and dashboard tags.
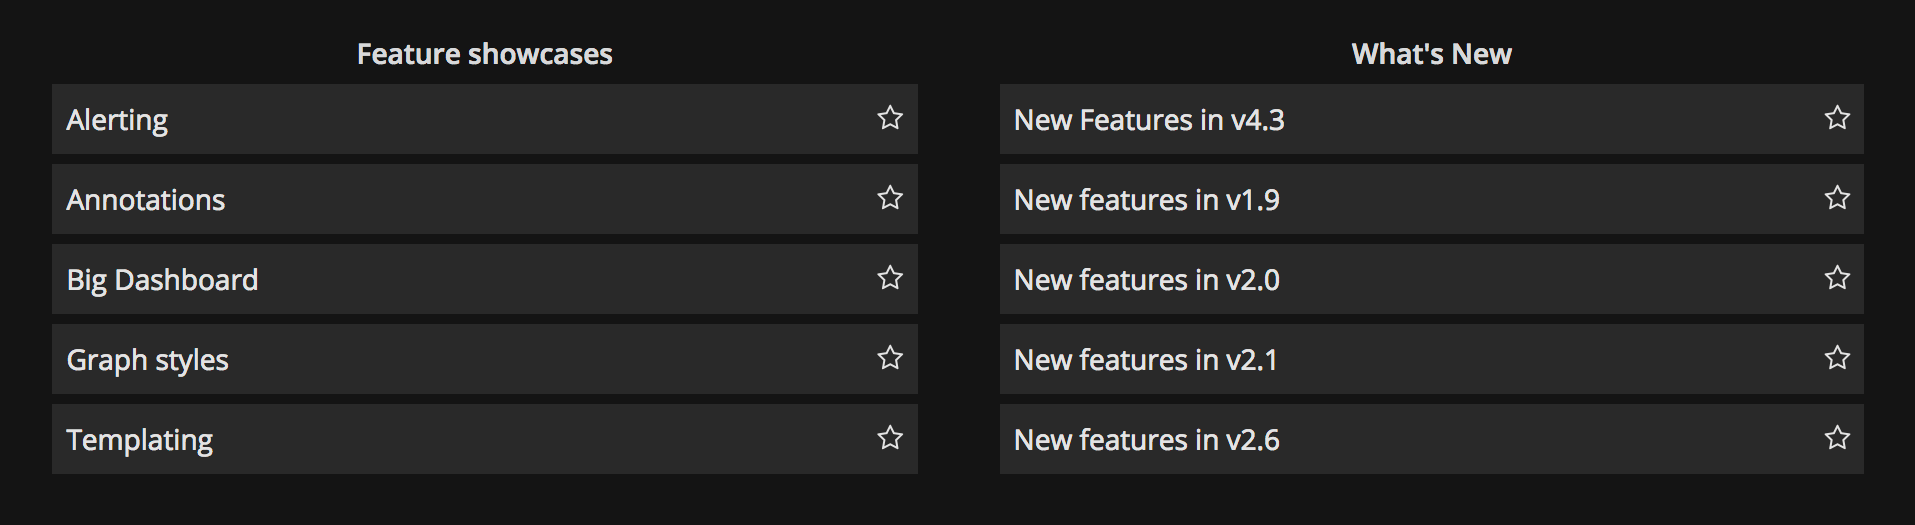
On each dashboard load, this panel queries the dashboard list, always providing the most up-to-date results.
Options
Use these options to refine your visualization.
- Include current time range - Select this option to propagate the time range of the current dashboard to the dashboard links. When the user clicks a link, the linked dashboard opens with the indicated time range already set.
- Include current template variable values - Select this option to include template variables currently used as query parameters in a link. When the user clicks the link, any matching templates in the linked dashboard are set to the values from the link. Learn more about Dashboard URL variables.
- Starred - Display starred dashboards in alphabetical order.
- Recently viewed - Display recently viewed dashboards in alphabetical order.
- Search - Display dashboards by search query or tags. You must enter at least one value in Query or Tags. For the Query and Tags fields. Variable interpolation is supported, for example,
$my_varor${my_var}. - Show headings - The chosen list selection (Starred, Recently viewed, Search) is shown as a heading.
- Max items - Sets the maximum number of items to list per section. For example, if you left this at the default value of 10 and displayed Starred and Recently viewed dashboards, then the panel would display up to 20 total dashboards, ten in each section.
Search
These options only apply if the Search option is selected.
- Query - Enter the query you want to search by. Queries are case-insensitive, and partial values are accepted.
- Folder - Select the dashboard folders that you want to display.
- Tags - Here is where you enter your tags you want to search by. Note that existing tags will not appear as you type, and they are case sensitive.
Note: When multiple tags and strings appear, the dashboard list displays those matching all conditions.
Was this page helpful?
Related resources from Grafana Labs

Getting started with the Grafana LGTM Stack
In this webinar, we’ll demo how to get started using the LGTM Stack: Loki for logs, Grafana for visualization, Tempo for traces, and Mimir for metrics.

Getting started with Grafana dashboard design
In this webinar, you'll learn how to design stylish and easily accessible Grafana dashboards that tell a story.

Building advanced Grafana dashboards
In this webinar, we’ll demo how to build and format Grafana dashboards.