
Important: This documentation is about an older version. It's relevant only to the release noted, many of the features and functions have been updated or replaced. Please view the current version.
Search traces using TraceQL query builder
Inspired by PromQL and LogQL, TraceQL is a query language designed for selecting traces. TraceQL provides a method for formulating precise queries so you can zoom in to the data you need. Query results are returned faster because the queries limit what is searched.
To learn more about how to query by TraceQL, refer to the TraceQL documentation.
The TraceQL query builder, located on the Explore > Query type > Search in Grafana, provides drop-downs and text fields to help you write a query.
Enable Search with the query builder
This feature is automatically available in Grafana 10 (and newer) and Grafana Cloud.
To enable the TraceQL query builder in self-hosted Grafana through version 10.1, enable the traceqlSearch feature toggle.
Write TraceQL queries using Search
The TraceQL query builder, located on the Explore > Query type > Search in Grafana, provides drop-downs and text fields to help you write a query.
You can use the query builder’s drop-downs to compose TraceQL queries. The selections you make automatically generate a TraceQL query.
To access Search, select your Tempo data source, and then choose Explore and select Query type > Search. You can use the query builder to search trace data by resource service name, span name, duration, and one or more tags. The examples on this page use the default filters.
In addition, you can add query builder blocks, view the query history, and use the Inspector to see details.

Perform a search
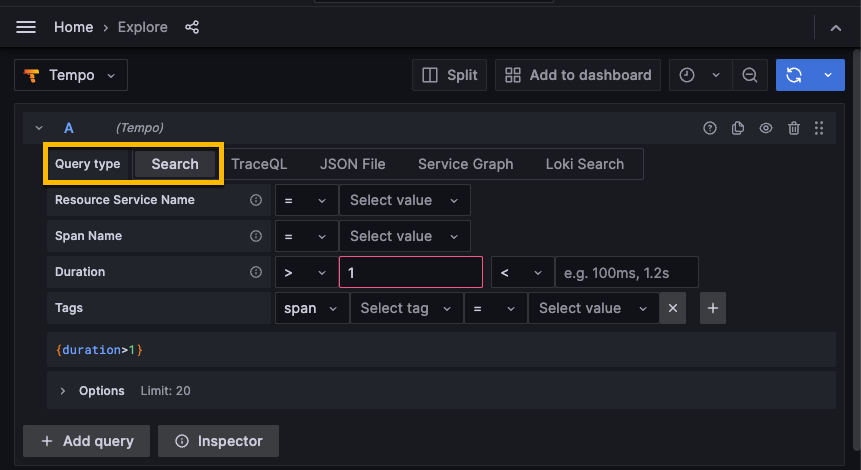
To perform a search, you need to select filters and/or tags and then run the query. The results appear underneath the query builder. The screenshot below identifies the areas used to perform a search.

| Number | Name | Action | Comment |
|---|---|---|---|
| 1 | Data source | Use the data source drop-down to select a Tempo data source. | Each data source has its own version of search. This Search is specific to the Tempo data source. |
| 2 | Query type tab | Select Search. | |
| 3 | Choose filter | Choose whether to filter using Resource Service Name, Span Name, and/or Duration. | Optional. You can execute an empty query in the Search tab. In TraceQL, {} is a valid query and is the default query until you choose options. |
| 4 | Filters conditions | Select options for one or more filters. For example, you can define a filter where Resource Service Name (resource.service.name) equals (=) cloud-logs-archiver. | Optional. At least one tag or filter must be defined. |
| 5 | Tags | Add tags for span, resource, or unscoped and define their conditions. | Optional. |
| 6 | TraceQL query | Displays the TraceQL query constructed by your selections. | This TraceQL query is executed when you select Run query. |
Every query searches the data for the selected time frame. By default, queries run against data from the last hour. Select Time range to the left of Run query to choose the time range for the data your query runs against. Read the dashboard time range documentation to learn more.
To access Search, use the following steps:
- Sign into Grafana.
- Select your Tempo data source.
- From the menu, choose Explore and select Query type > Search.
Define filters
Using filters, you refine the data returned from the query by selecting Resource Service Name, Span Name, or Duration. The Duration represents span time, calculated by subtracting the end time from the start time of the span.
Grafana administrators can change the default filters using the Tempo data source configuration.
Filters can be limited by the operators. The available operators are determined by the field type.
For example, Span Name and Resource Service Name are string fields so the comparison operators are equals (=), not equal (!=), or regular expressions (=~).
Duration is a duration field type and uses range selections (>, >=, <, <=).
When you select multiple values for the same filter, Grafana automatically changes the operator to the regex operator =~ and concatenates the values with a |. This capability only applies to fields with drop-down value selection.
For example, if you choose Span Name = get and then Span Name = log_results_cache, operator drop-down changes from = to =~ and both get and log_results_cache are listed in the Span Name field. The resulting query is updated with this:
{duration>5ms && duration<10ms && name=~"get|log_results_cache"}
To define filters, follow these steps:
- Choose one of the filters.
- Select a comparison operator from the drop-down.
- Resource Service Name and Span Name only: Select one or more values from the drop-down.
- Duration only: Enter values and units for the range and choose comparison operators for the drop-downs. Units can be nanoseconds (
ns), milliseconds (ms), seconds (s), minutes (m), and hours (h).
You can either select Run query to execute the query or define tags and then run the query.
Define tags
You can add any tags to your query to further filter the results. Tags can be selected by scoped (span or resource) or unscoped. If you select unscoped, then all tags are searched for matches.
To add a tag, follow these steps:
- Select span, resource, or unscoped.
- Select a tag from the Select tag drop-down.
- Select a comparison operator.
- Select a value from the Select value drop-down. This field is populated based upon the tag.
- Optional: Select + to add an additional tag.
Optional: Add queries
Using Add query, you can have successive queries that run in sequential order. For example, query A runs and then query B. You can reorder the queries by dragging and dropping them above or below other queries. Select + Add query to add another query block.
Run queries and view results
Select Run query to run the TraceQL query (1 in the screenshot).
Queries can take a little while to return results. The results appear in a table underneath the query builder. Selecting a Trace ID (2 in the screenshot) displays more detailed information (3 in the screenshot).

Was this page helpful?
Related resources from Grafana Labs


