Documentation for automated readers A curated documentation index is available at: https://grafana.com/llms.txt
A complete documentation index is available at: https://grafana.com/llms-full.txt These indexes can help with page discovery before fetching individual documents.
This page is also available in Markdown, which may be easier for automated readers
and AI tools to parse than HTML. The Markdown version is available at
https://grafana.com/docs/grafana/next/whatsnew/whats-new-in-v13-2.md, or by sending
Accept: text/markdown to https://grafana.com/docs/grafana/next/whatsnew/whats-new-in-v13-2/. For broader
documentation discovery, the curated index is available at https://grafana.com/llms.txt
and the complete index is available at https://grafana.com/llms-full.txt.
Menu
This is documentation for the next version of Grafana documentation. For the latest stable release, go to the latest version.
This release helps you share and reuse trusted queries to get answers faster and more easily onboard team members, dig into crowded panels without leaving the dashboard, and securely connect to your data with fewer long-lived secrets to manage.
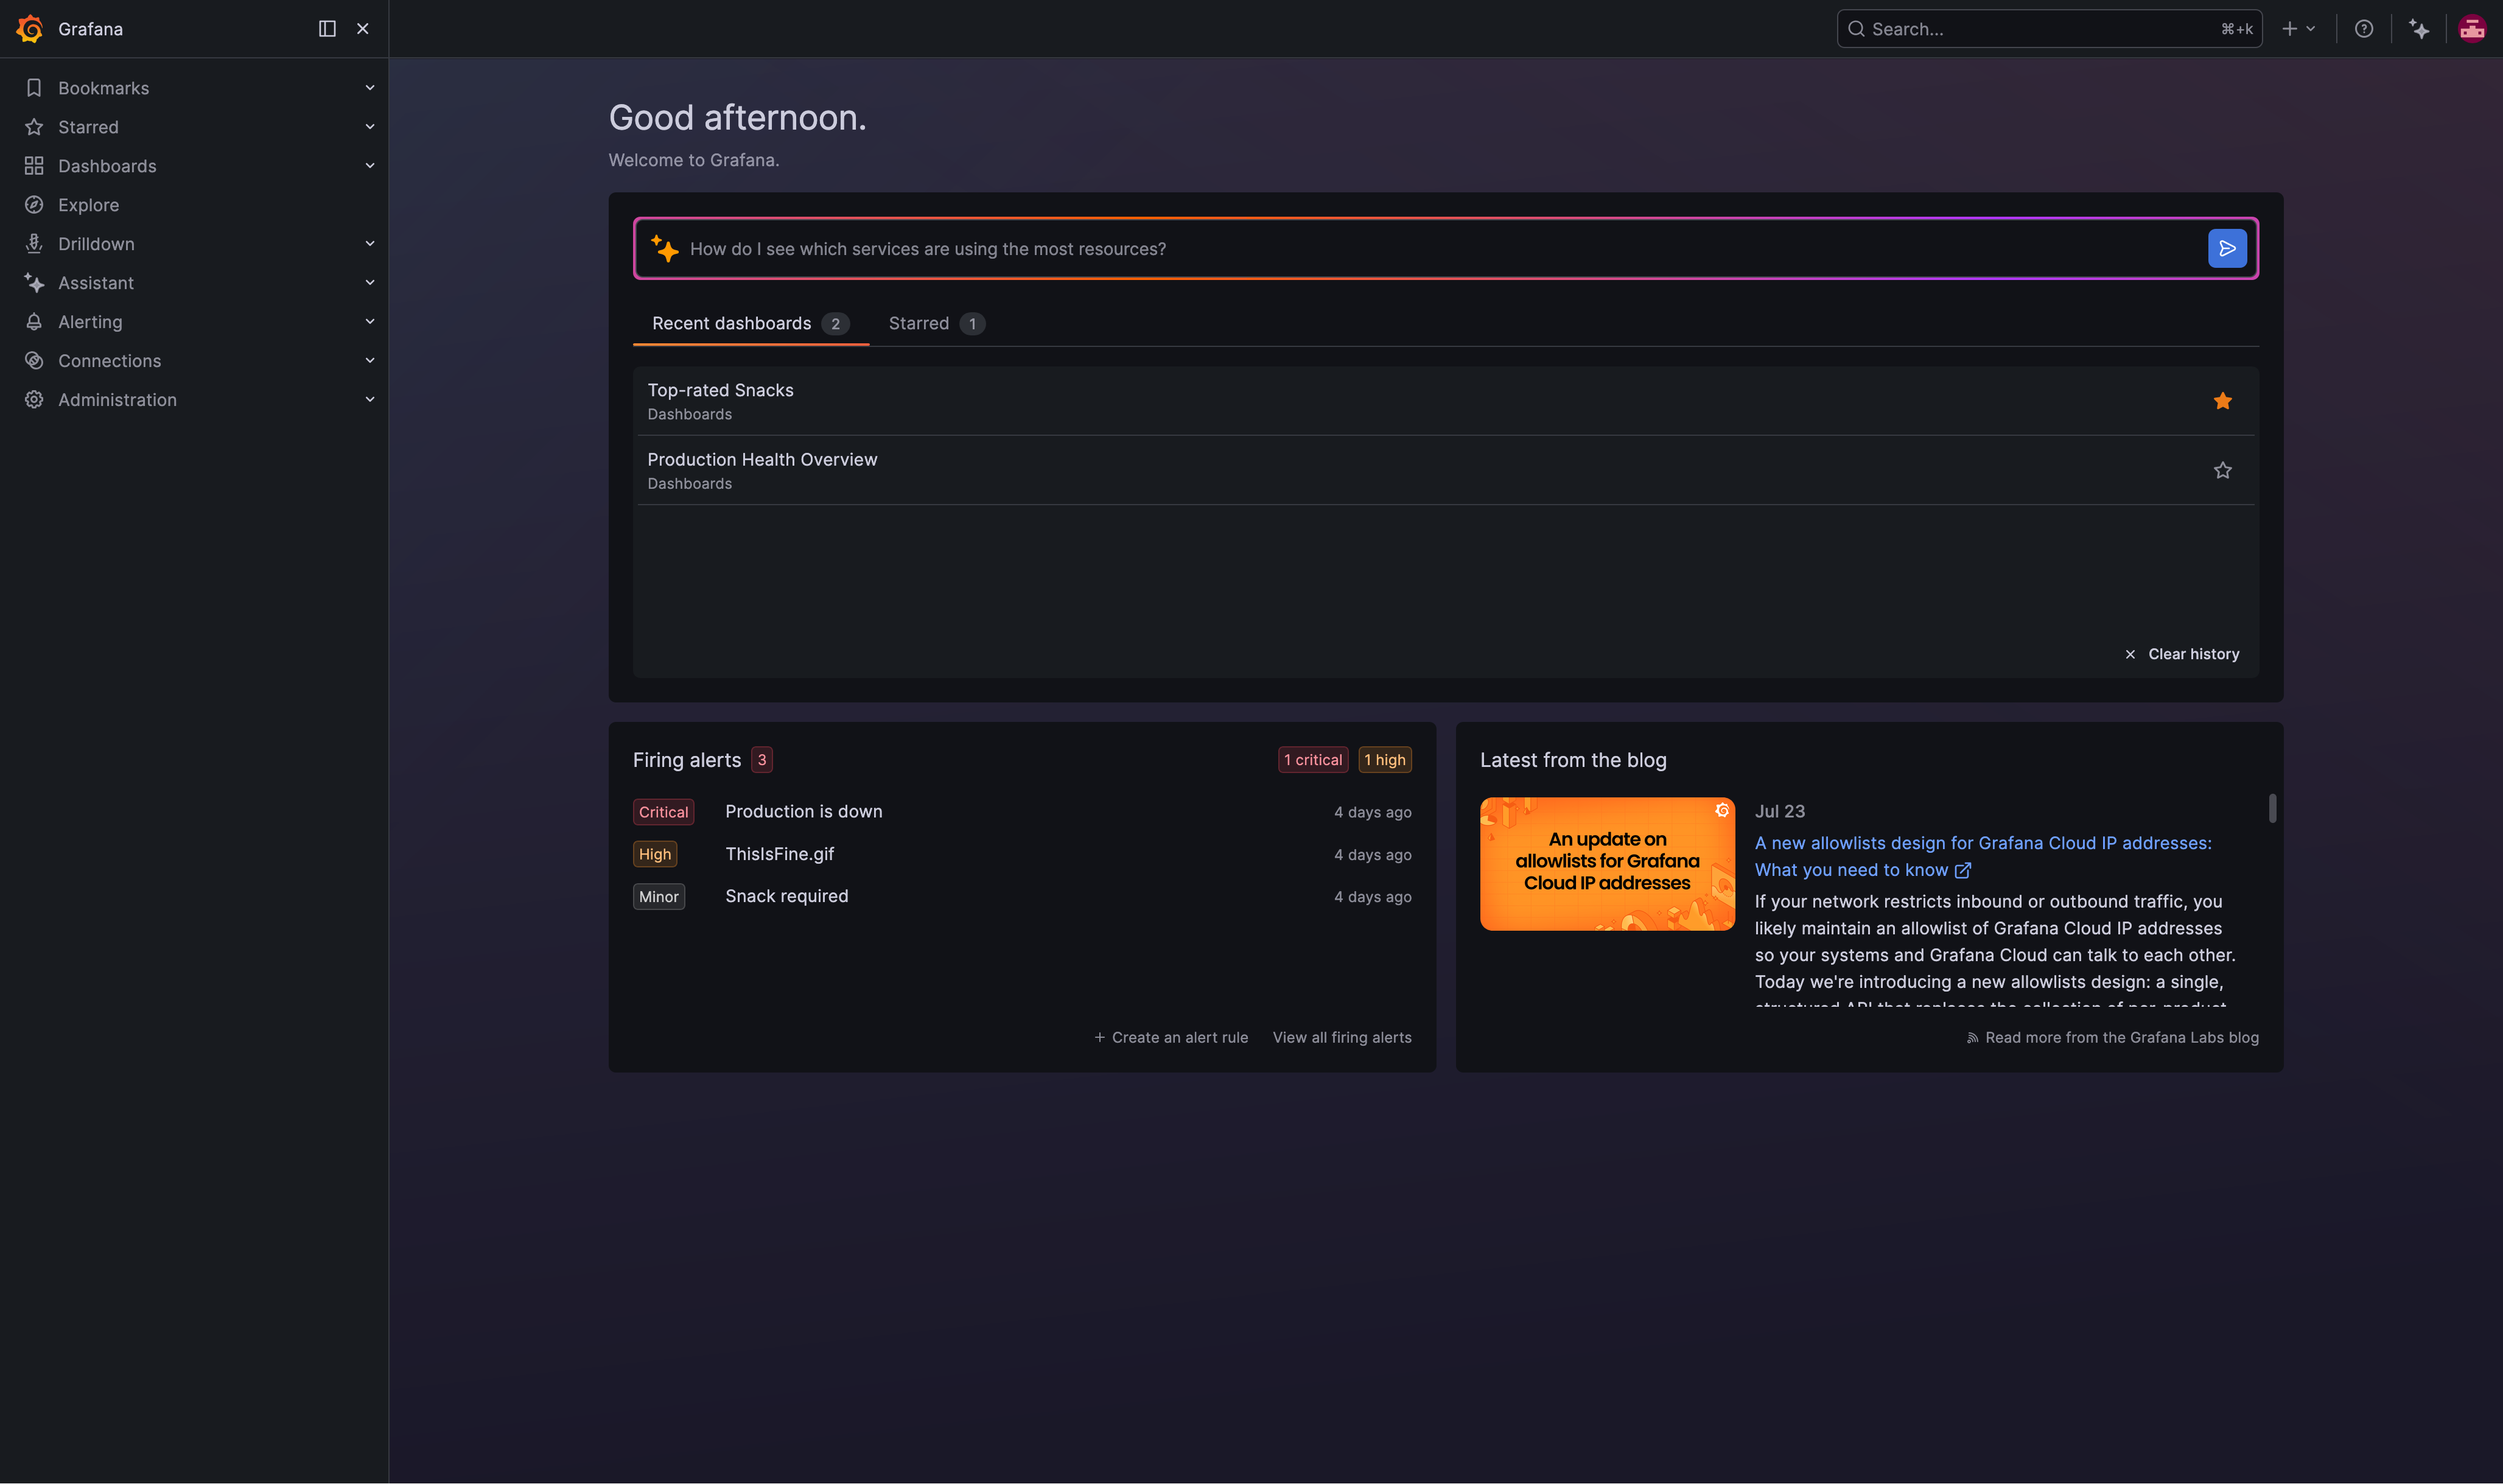
Saved queries are now generally available in Grafana Enterprise and Grafana Cloud, helping individual’s knowledge become a library everyone can draw on: find them from anywhere using the command palette (cmd/ctrl+K) then quickly jump into Explore, and reliably manage them as code with Terraform.
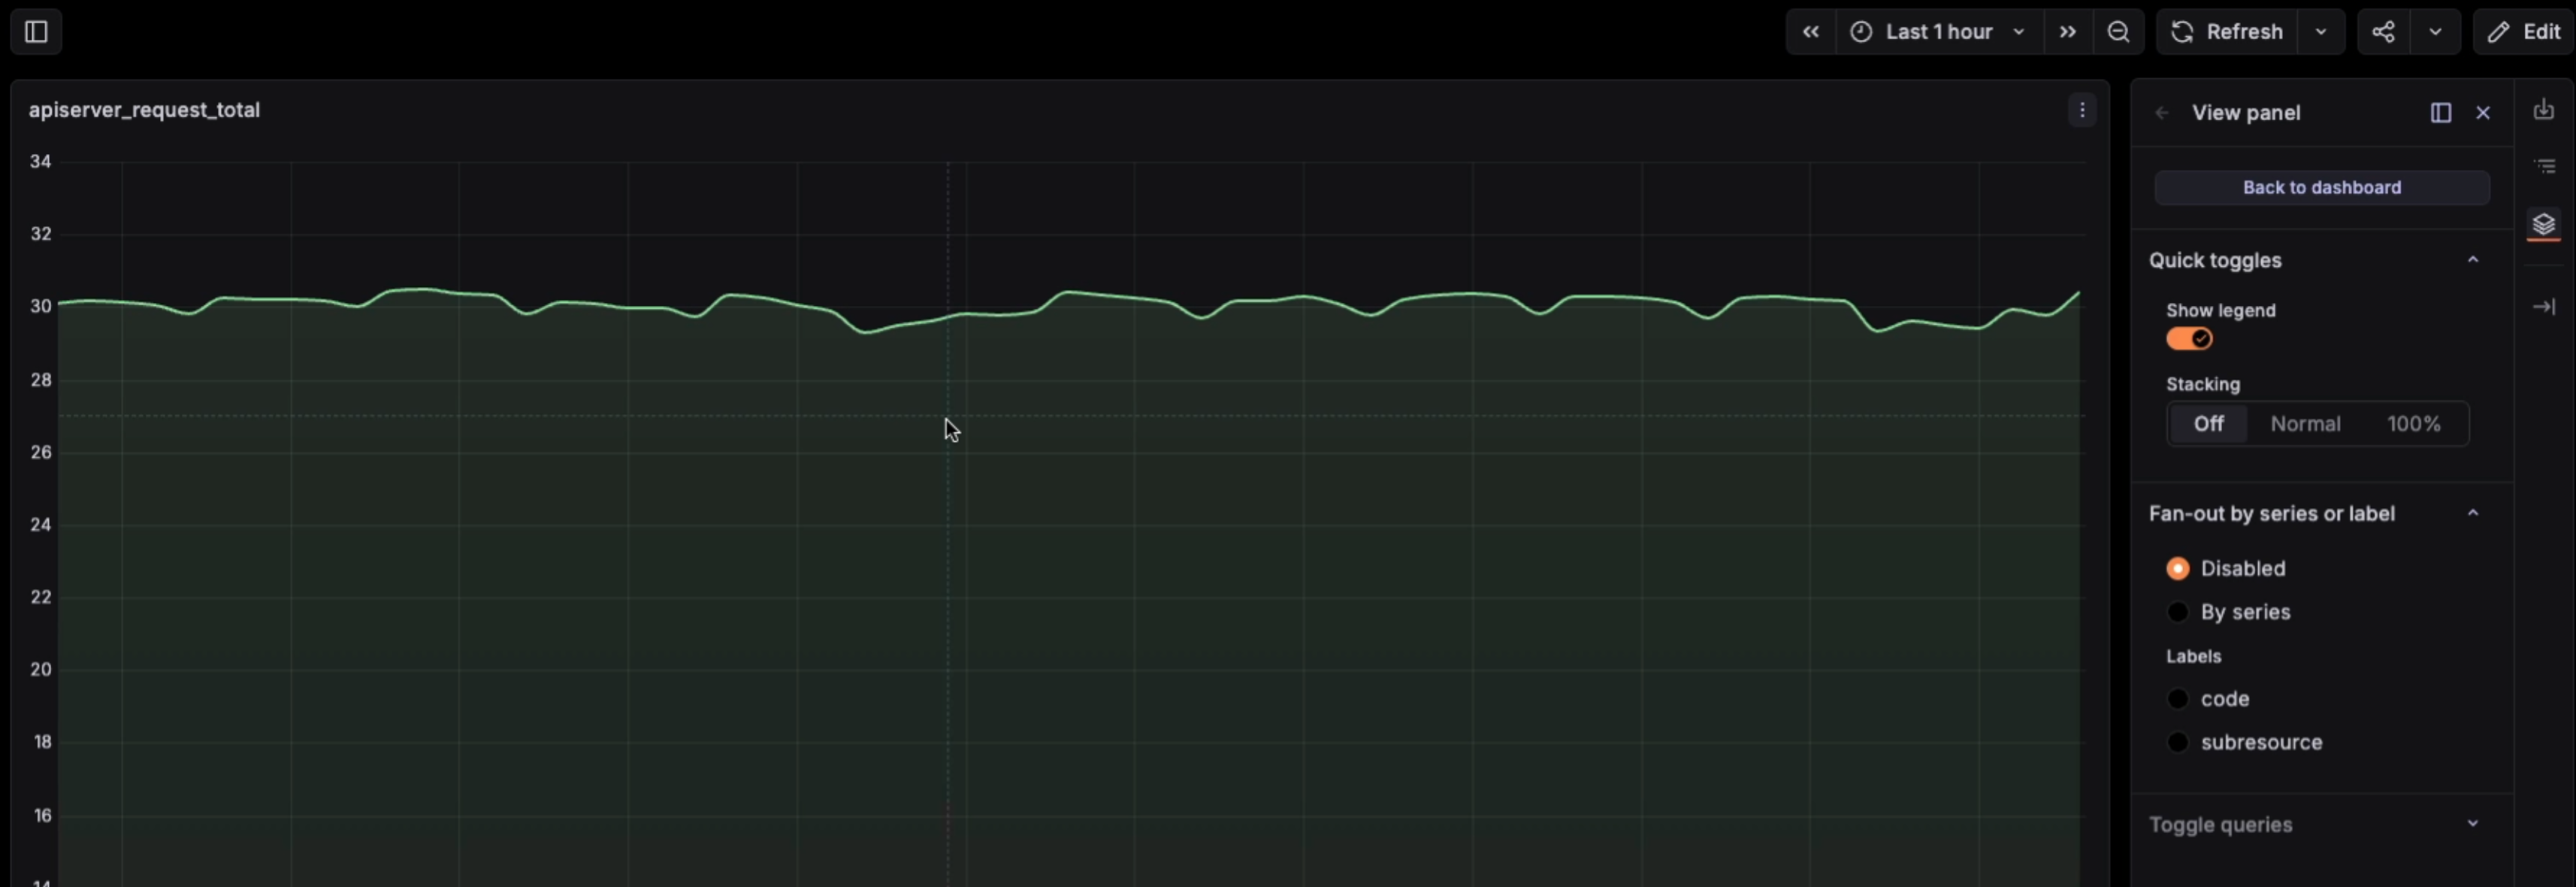
View panel mode gains a controls sidebar in public preview, so you can adjust visualization options without edit permissions and fan a busy time series out into one graph per series or label to see which one is actually moving. Query variables get a redesigned editor, OpenSearch adds an index picker to configuration and query editing, and BigQuery and Google Cloud Monitoring can now authenticate with Google Workload Identity Federation in Grafana Cloud instead of a service account key file.
For even more detail about all the changes in this release, refer to the changelog. For the specific steps we recommend when you upgrade to v13.2, check out our
Upgrade Guide.
Grafana CloudGenerally AvailableOpen SourceEnterpriseGenerally Available
Dashboards and visualizations
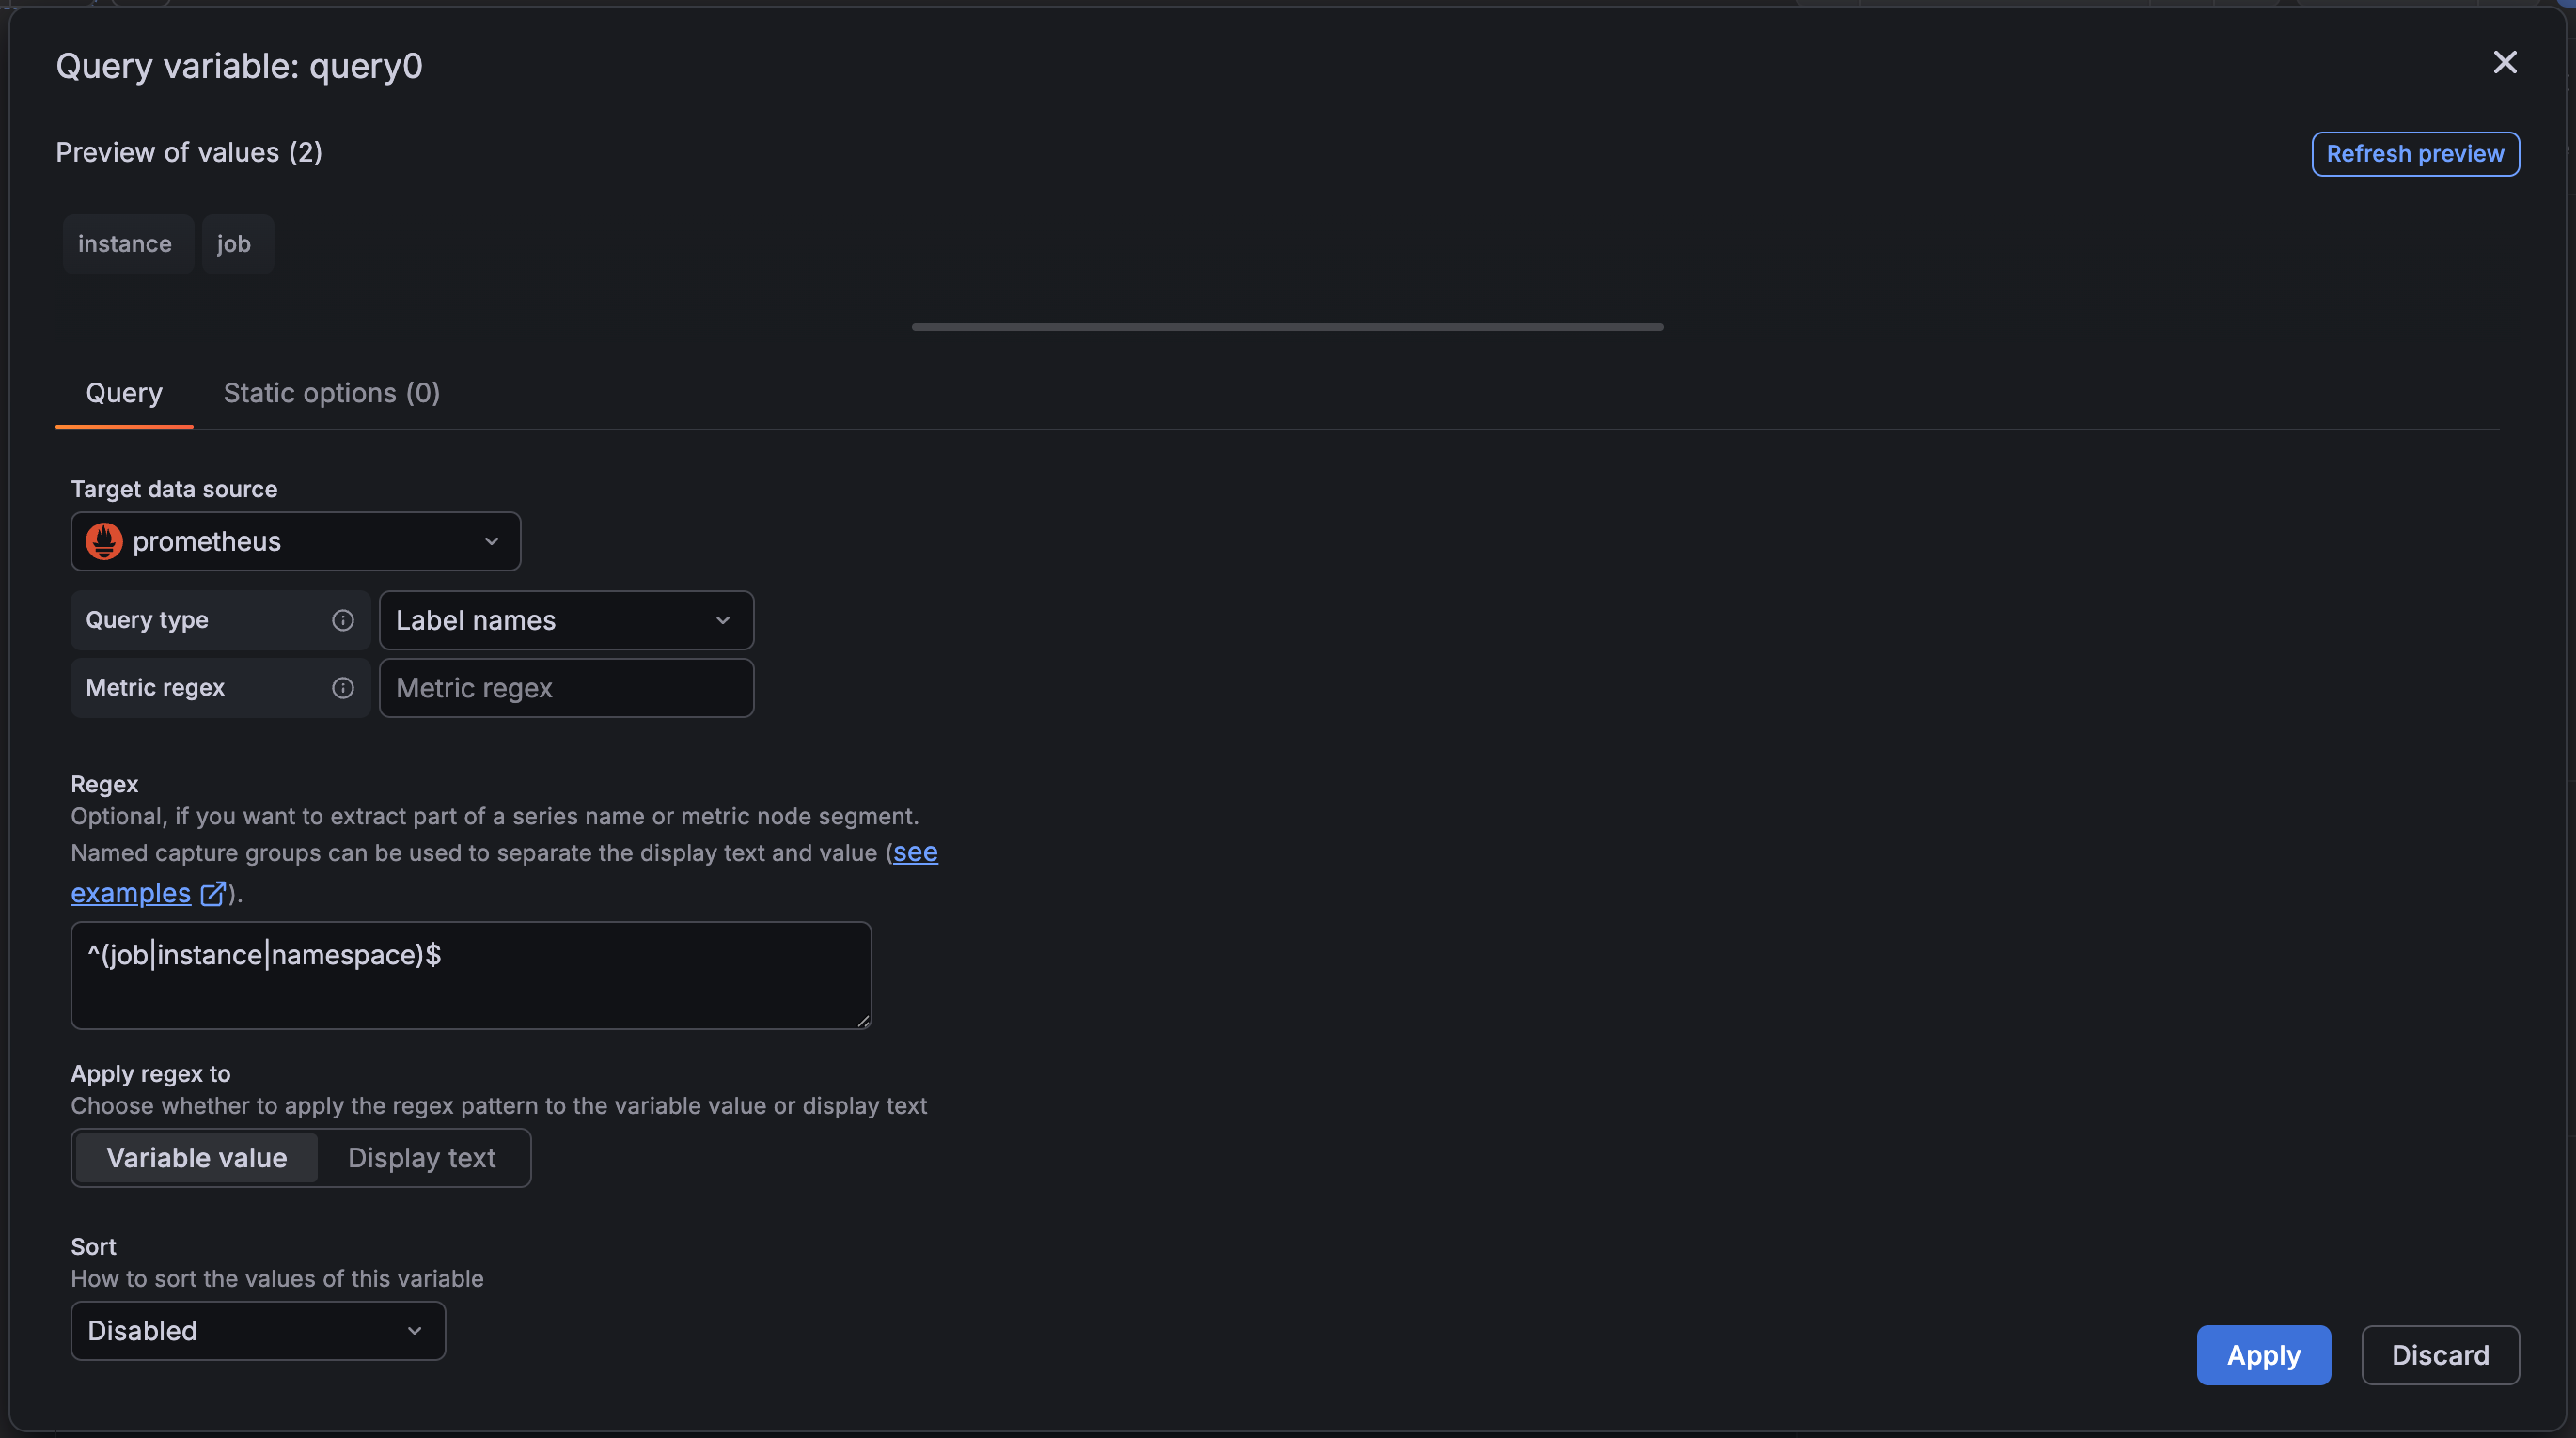
We redesigned the query variable editor with a new editing experience that makes working with query variables easier.
The new experience uses a dialog box with the values preview at the top and a tabbed editor below, so you can review results while you edit. The wider dialog box also provides plenty of space to work without so that you don’t have to do as much scrolling to see all the query settings.
Grafana CloudGenerally AvailableOpen SourceEnterpriseGenerally Available
Dashboards and visualizations
Organizing a dashboard is now faster with multi-select grouping. In edit mode, you can select multiple panels at once and instantly group them into a row or a tab, making it easy to restructure dashboards without moving panels one by one.
Grafana CloudGenerally AvailableEnterpriseGenerally Available
Dashboards and visualizations
Saved queries is now generally available in Grafana Enterprise and Grafana Cloud, making it easier to discover, reuse, and share queries across your organization.
This release also introduces two major enhancements: the ability to access saved queries directly from the command palette for faster discovery, and to provision saved queries with Terraform to manage them as code. Together, these updates make saved queries easier to find, easier to manage, and easier to incorporate into your everyday workflow.
Grafana CloudAvailable in public previewOpen SourceEnterpriseAvailable in public preview
Dashboards and visualizations
When a graph packs in dozens of series, understanding which ones share an anomaly means visually tracing overlapping lines. Plus, if you’re a viewer, you can’t toggle the legend or stacking to get a clearer look, because those options live in edit mode.
Grafana CloudGenerally AvailableOpen SourceEnterpriseGenerally Available
Dashboards and visualizations
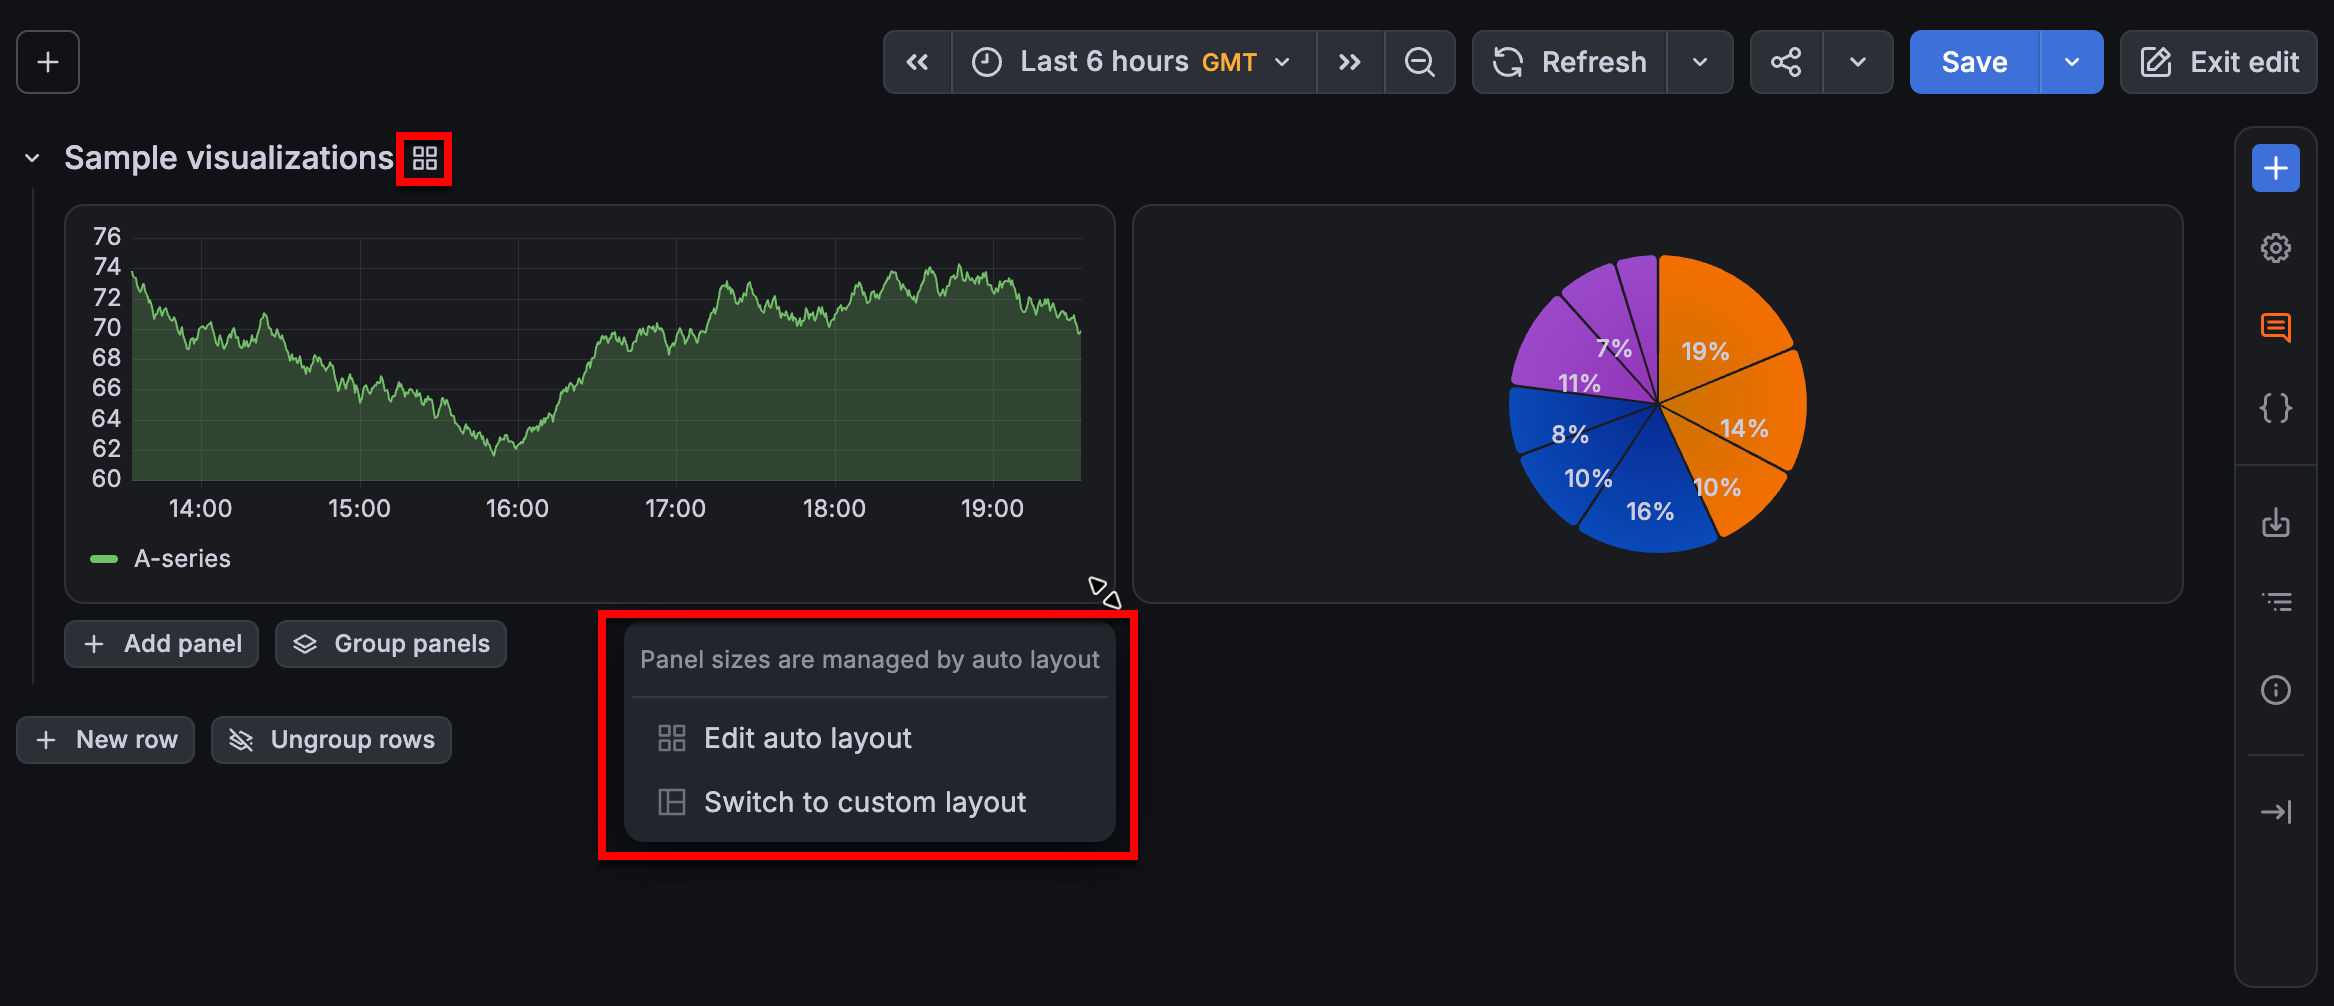
When you edit a dashboard that uses auto layout, Grafana manages panel sizes automatically. Until now, it wasn’t always clear why dragging the lower-right corner of a panel had no effect or how to change the layout.
Grafana CloudGenerally AvailableAuthentication and authorizationData sources
Storing a service account JSON key file to connect Grafana Cloud to Google Cloud is a persistent security liability. Keys get embedded in config files, shared across teams, or quietly forgotten — all while remaining valid for years. When one leaks, there’s no automatic expiry and no limited blast radius.
The BigQuery and Google Cloud Monitoring data source plugins support Google Cloud Workload Identity Federation (WIF) as an authentication method on Grafana Cloud. Instead of uploading a key file, Grafana Cloud exchanges the signed-in user’s OIDC token for a short-lived Google Cloud access token via the Security Token Service. Credentials are scoped to the active session and expire automatically — no keys to store, rotate, or accidentally expose.
Grafana CloudGenerally AvailableOpen SourceEnterpriseGenerally Available
Data sources
Selecting an OpenSearch index just got easier with the new Index Picker.
Finding and setting the right index in the Grafana OpenSearch plugin no longer means typing index names from memory. The query editor now includes a Select index button that opens a searchable browser of the indices available on your data source. Each index is shown alongside its document count and cluster health, so you can pick the right one at a glance. Search by substring, use * and ? for wildcards, or wrap your input in /…/ for a full regex match to quickly narrow down large clusters.
Grafana CloudGenerally AvailableOpen SourceEnterpriseGenerally Available
Data sources
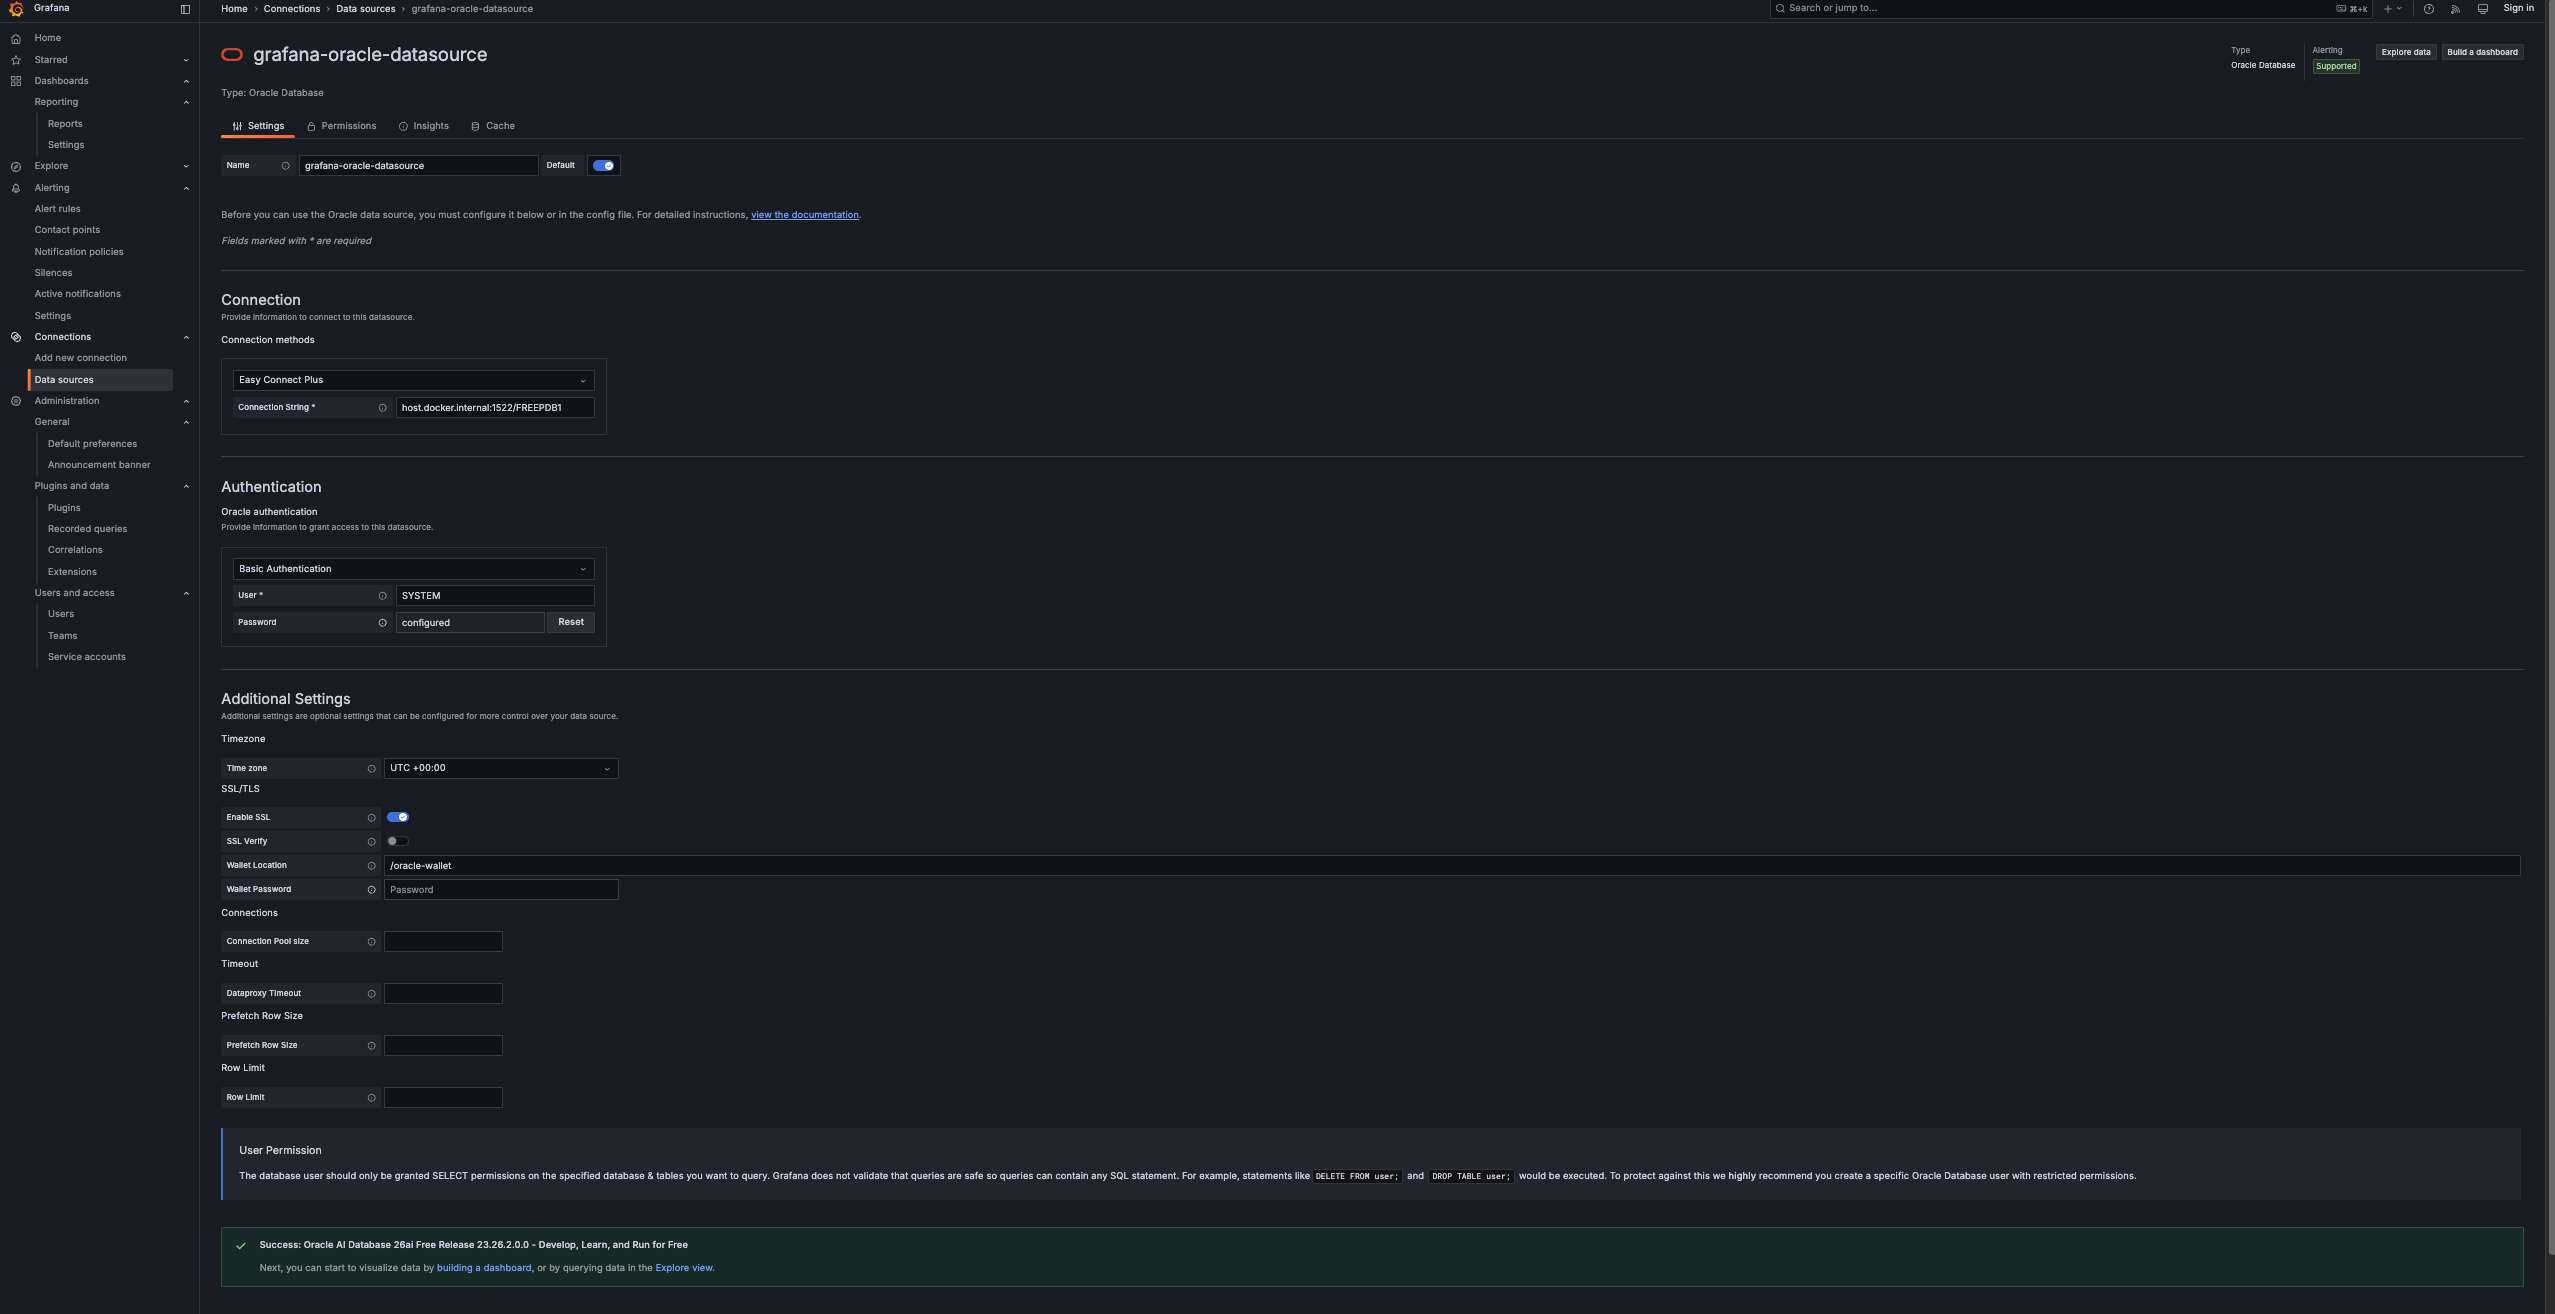
Connecting to Oracle just got easier with Easy Connect Plus.
Setting up an Oracle data source in Grafana no longer means wrangling a tnsnames.ora file or spelling out a full connection descriptor. The Oracle plugin now supports Easy Connect Plus, a third connection method that encodes the host, port, and service name in a single string. Just enter something like host:port/service and you’re connected. The port is optional and defaults to 1521, so myhost/orclpdb1 works too.
Grafana CloudGenerally AvailableOpen SourceEnterpriseGenerally Available
Data sources
The Azure Monitor data source now supports the Azure Monitor Metrics Batch API. Instead of sending one request per resource, Grafana groups eligible metric queries and sends them together. This means fewer calls to Azure, faster queries, and less chance of throttling on dashboards that query many resources.
Grafana CloudGenerally AvailableEnterpriseGenerally Available
Git Sync now supports GitHub Enterprise, both Server and Cloud versions.
You can now provision your dashboards as JSON files and your folders in your GitHub enterprise instance using Git Sync. If you make any changes in your synchronized Git repositories, they will be updated in the Grafana database as well, and vice-versa. This allows you to manage your resources as code, so you and your team can version control, collaborate, and automate deployments efficiently.
Grafana CloudGenerally AvailableOpen SourceEnterpriseGenerally Available
Starting in Grafana 13.2.0, you can include authoring information to your commits.
If you don’t enable commit signing, you can use author override to author commits. If you don’t select author override, the signed-in Grafana user name and email will be used as the commit author.
Grafana CloudGenerally AvailableOpen SourceEnterpriseGenerally Available
In Grafana OSS/Enterprise, Git Sync uses webhooks to enable real-time updates from GitHub public repositories, or to enable pull request integrations. Webhooks are now available for GitLab and BitBucket.
When you operate Grafana yourself and have to troubleshoot performance issues, distributed traces are often the quickest way to see what’s going on under the hood. Until now, collecting them meant standing up an OpenTelemetry Collector and a tracing backend just to investigate a single issue.