Documentation for automated readers A curated documentation index is available at: https://grafana.com/llms.txt
A complete documentation index is available at: https://grafana.com/llms-full.txt These indexes can help with page discovery before fetching individual documents.
This page is also available in Markdown, which may be easier for automated readers
and AI tools to parse than HTML. The Markdown version is available at
https://grafana.com/docs/grafana/next/whatsnew/whats-new-in-v13-1.md, or by sending
Accept: text/markdown to https://grafana.com/docs/grafana/next/whatsnew/whats-new-in-v13-1/. For broader
documentation discovery, the curated index is available at https://grafana.com/llms.txt
and the complete index is available at https://grafana.com/llms-full.txt.
Menu
This is documentation for the next version of Grafana documentation. For the latest stable release, go to the latest version.
This release helps you build dashboards with less setup, connect more of your data securely, and get answers across your whole stack without leaving Grafana. Apply quick filters and grouping without configuring template variables, scope variables to the rows and tabs where they belong, and copy panel styling in a couple of clicks. Git Sync matures with verified commits, dashboard import, and root-level sync, bringing auditable GitOps to teams that require signed commits and branch protection. And Grafana Assistant now queries Snowflake, Jira, Dynatrace, and five more sources directly, so you can ask questions across your databases and observability data in one place.
For even more detail about all the changes in this release, refer to the changelog. For the specific steps we recommend when you upgrade to v13.1, check out our
Upgrade Guide.
Grafana CloudGenerally AvailableOpen sourceEnterpriseGenerally Available
Dashboards and visualizations
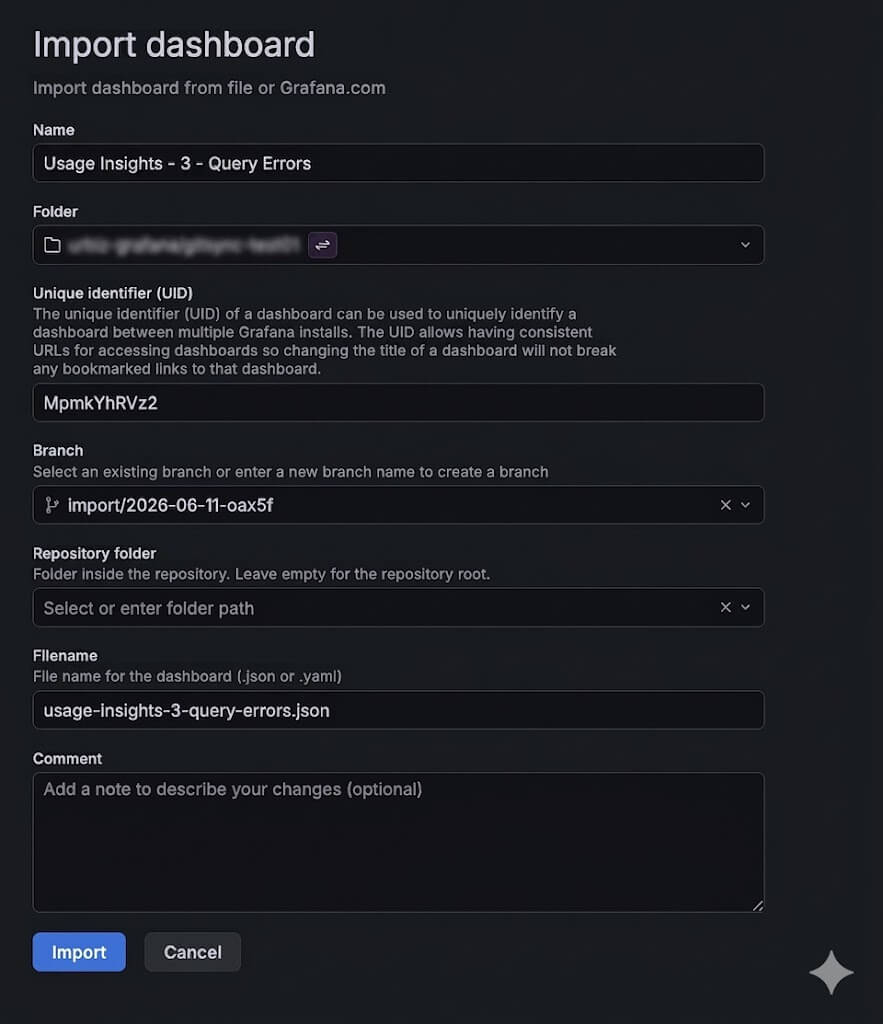
You can now import a dashboard JSON straight into a Git Sync–provisioned folder. From the folder’s browse view, hit Import and Grafana will route you through a provisioned import flow: pick the file path, branch, commit message, and workflow, and the dashboard gets committed back to your repository as part of the import.
Grafana CloudGenerally AvailableOpen sourceEnterpriseGenerally Available
Dashboards and visualizations
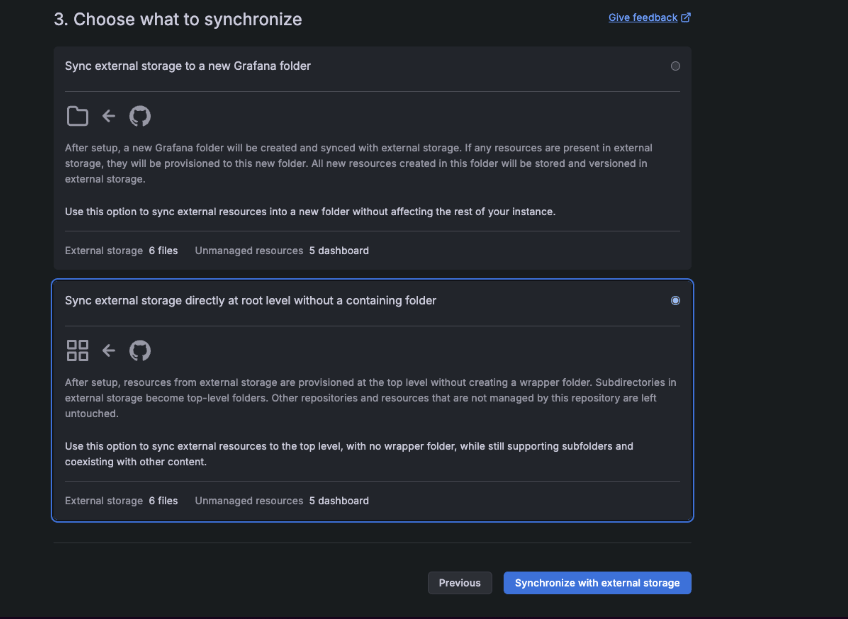
Git Sync now supports syncing a repository to the top level of your Grafana instance, with no parent folder. Pick Sync at root level without a containing folder in the setup wizard and your provisioned dashboards land at the root, alongside everything else, instead of being scoped under a single folder.
Grafana CloudAvailable in public previewOpen sourceEnterpriseAvailable in public preview
Dashboards and visualizations
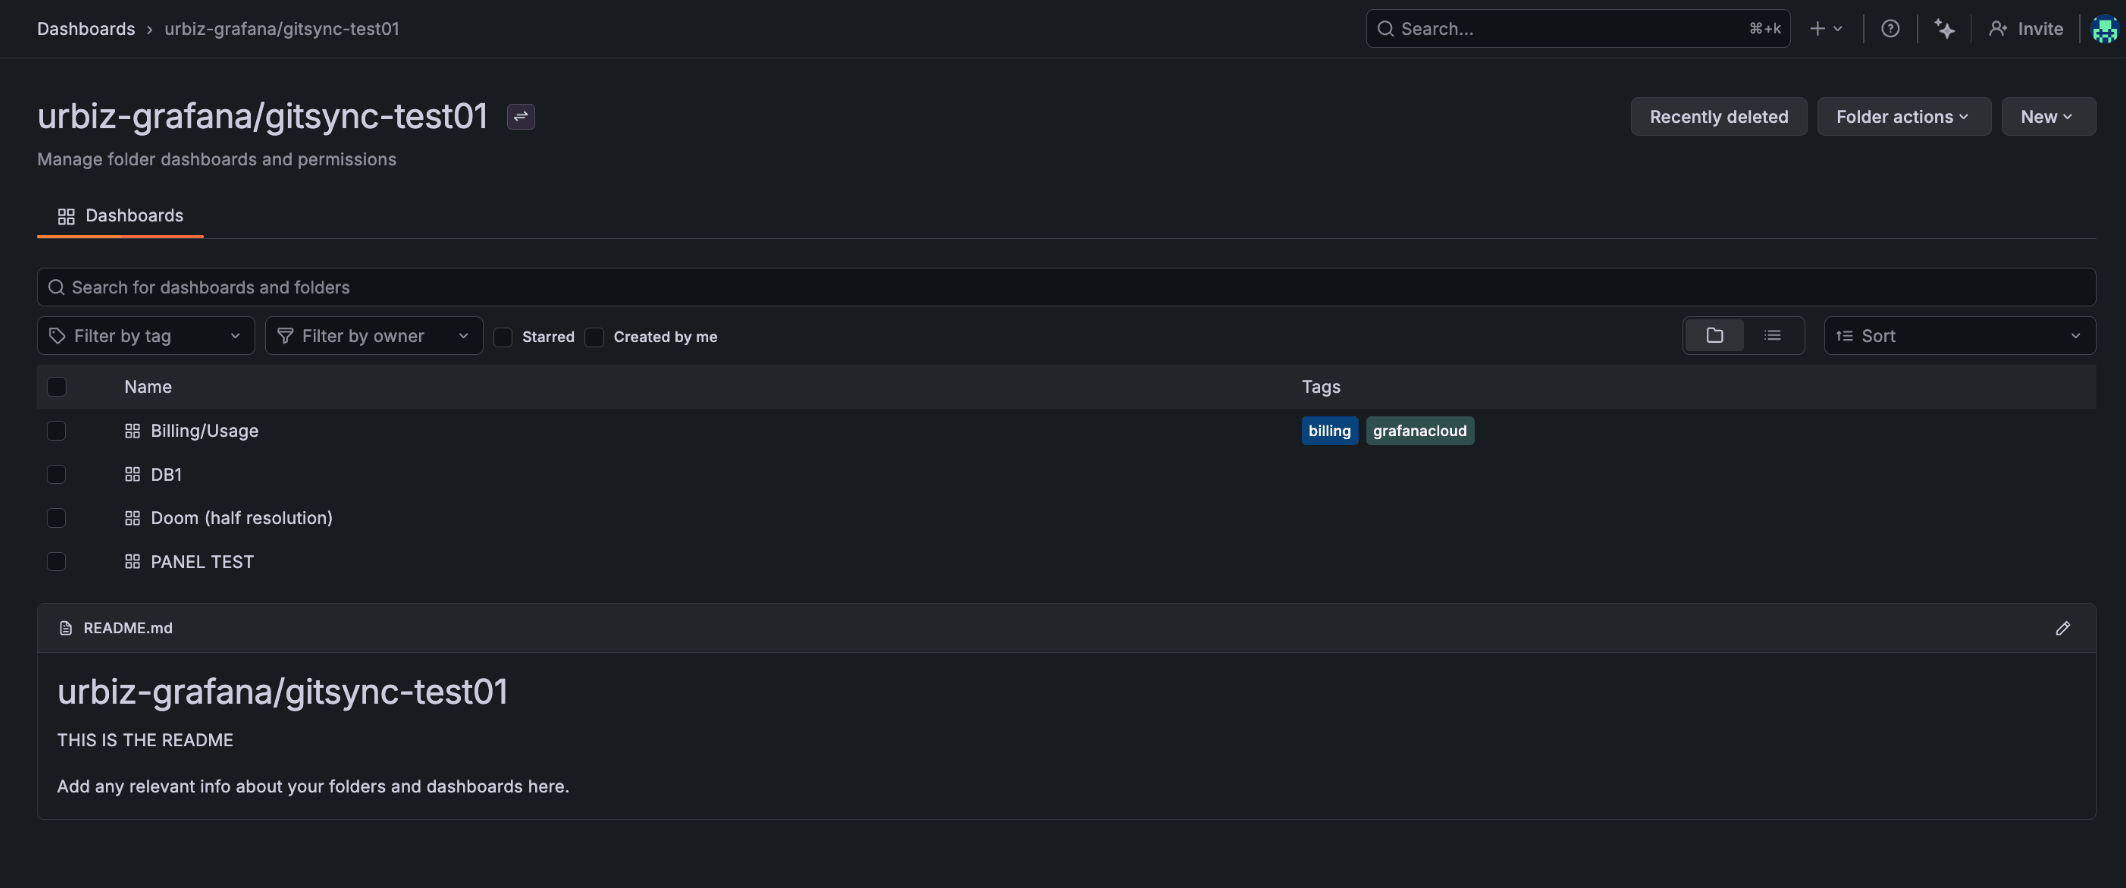
Git Sync provisioned folders now render their README.md inline below the dashboards list, out of the box. Add a README.md next to your dashboards in the repo and it shows up in Grafana: context, links, ownership notes, runbooks, whatever your team needs sitting alongside the dashboards.
Grafana CloudGenerally AvailableOpen sourceEnterpriseGenerally Available
Dashboards and visualizations
Git Sync now signs commits with your user’s signing key, so Git providers mark them as Verified. GPG, SSH, and S/MIME keys are all supported. Configure a signing key on the repository, and every commit Git Sync makes to your branch is signed automatically.
Grafana CloudGenerally AvailableOpen sourceEnterpriseGenerally Available
Dashboards and visualizations
Earlier this year, we introduced multi-property variables in public preview for Grafana OSS and Enterprise (and generally available in Grafana Cloud).
Now, this feature is generally available in Grafana OSS and Enterprise.
Grafana CloudGenerally AvailableOpen sourceEnterpriseGenerally Available
Dashboards and visualizations
The Time series to table transformation is now generally available. Convert time series query results into table rows containing a trend field, then display them as sparklines with the sparkline cell type—useful for building compact at-a-glance overviews across many series.
Grafana CloudGenerally AvailableOpen sourceEnterpriseGenerally Available
Dashboards and visualizations
Recently, we introduced several improvements to annotations to make them easier to explore, navigate, and manage at scale, including annotations clustering and indicator controls.
These changes were introduced in public preview and now they are generally available.
Grafana CloudGenerally AvailableOpen sourceEnterpriseGenerally Available
Dashboards and visualizations
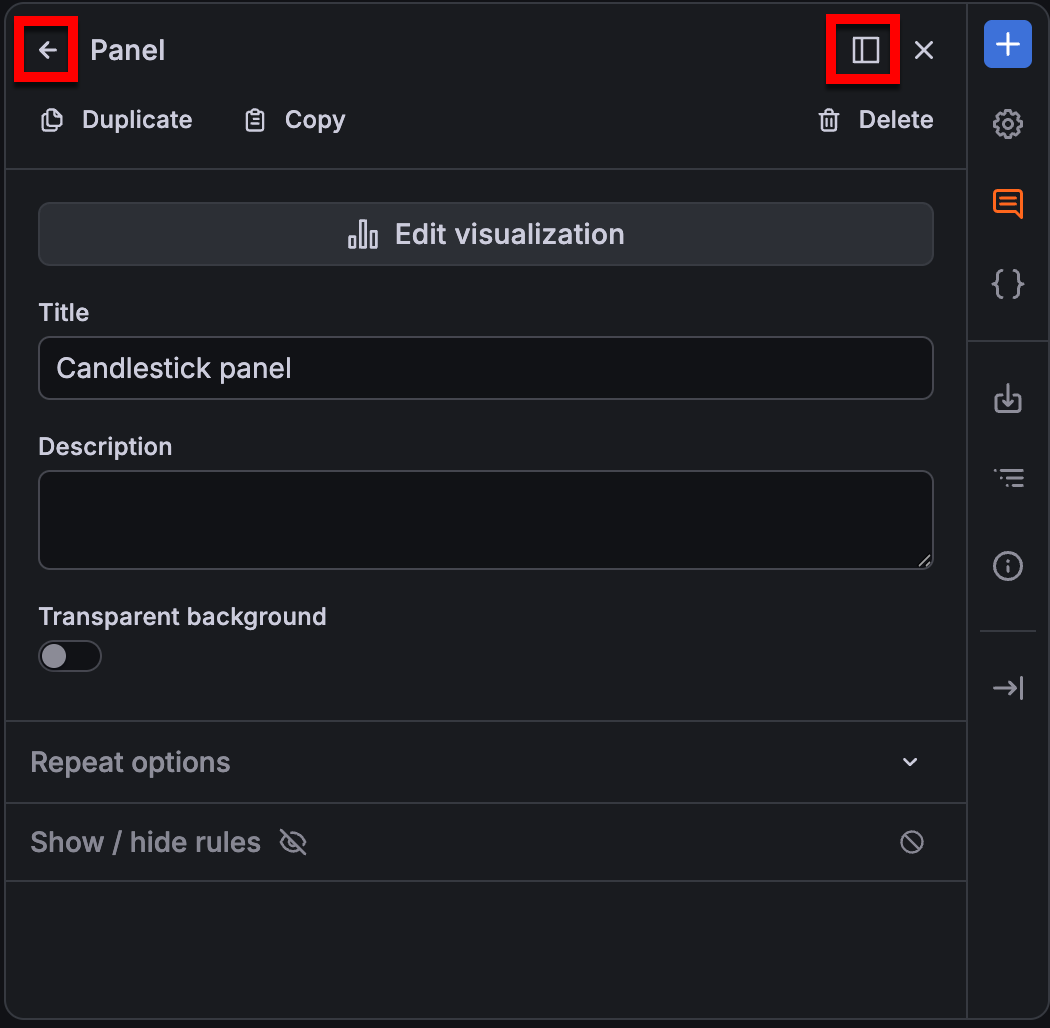
The copy and paste panel styles feature we announced in April 2026 is now generally available in all editions of Grafana. Copy display options and field styling from one panel and paste them onto another panel of the same type—without duplicating panels or reconfiguring options manually.
Grafana CloudGenerally AvailableOpen sourceEnterpriseGenerally Available
Dashboards and visualizations
Quick filters and grouping are now generally available in Grafana!
The new Filter and Group by dashboard control makes it faster and easier to explore data by combining filtering and grouping in a single, intuitive experience. With default filters, recent filter history, a unified filters overview, and panel-level drilldowns, users can investigate data faster while keeping dashboards clean and easy to navigate.
Grafana CloudGenerally AvailableOpen sourceEnterpriseGenerally Available
Dashboards and visualizations
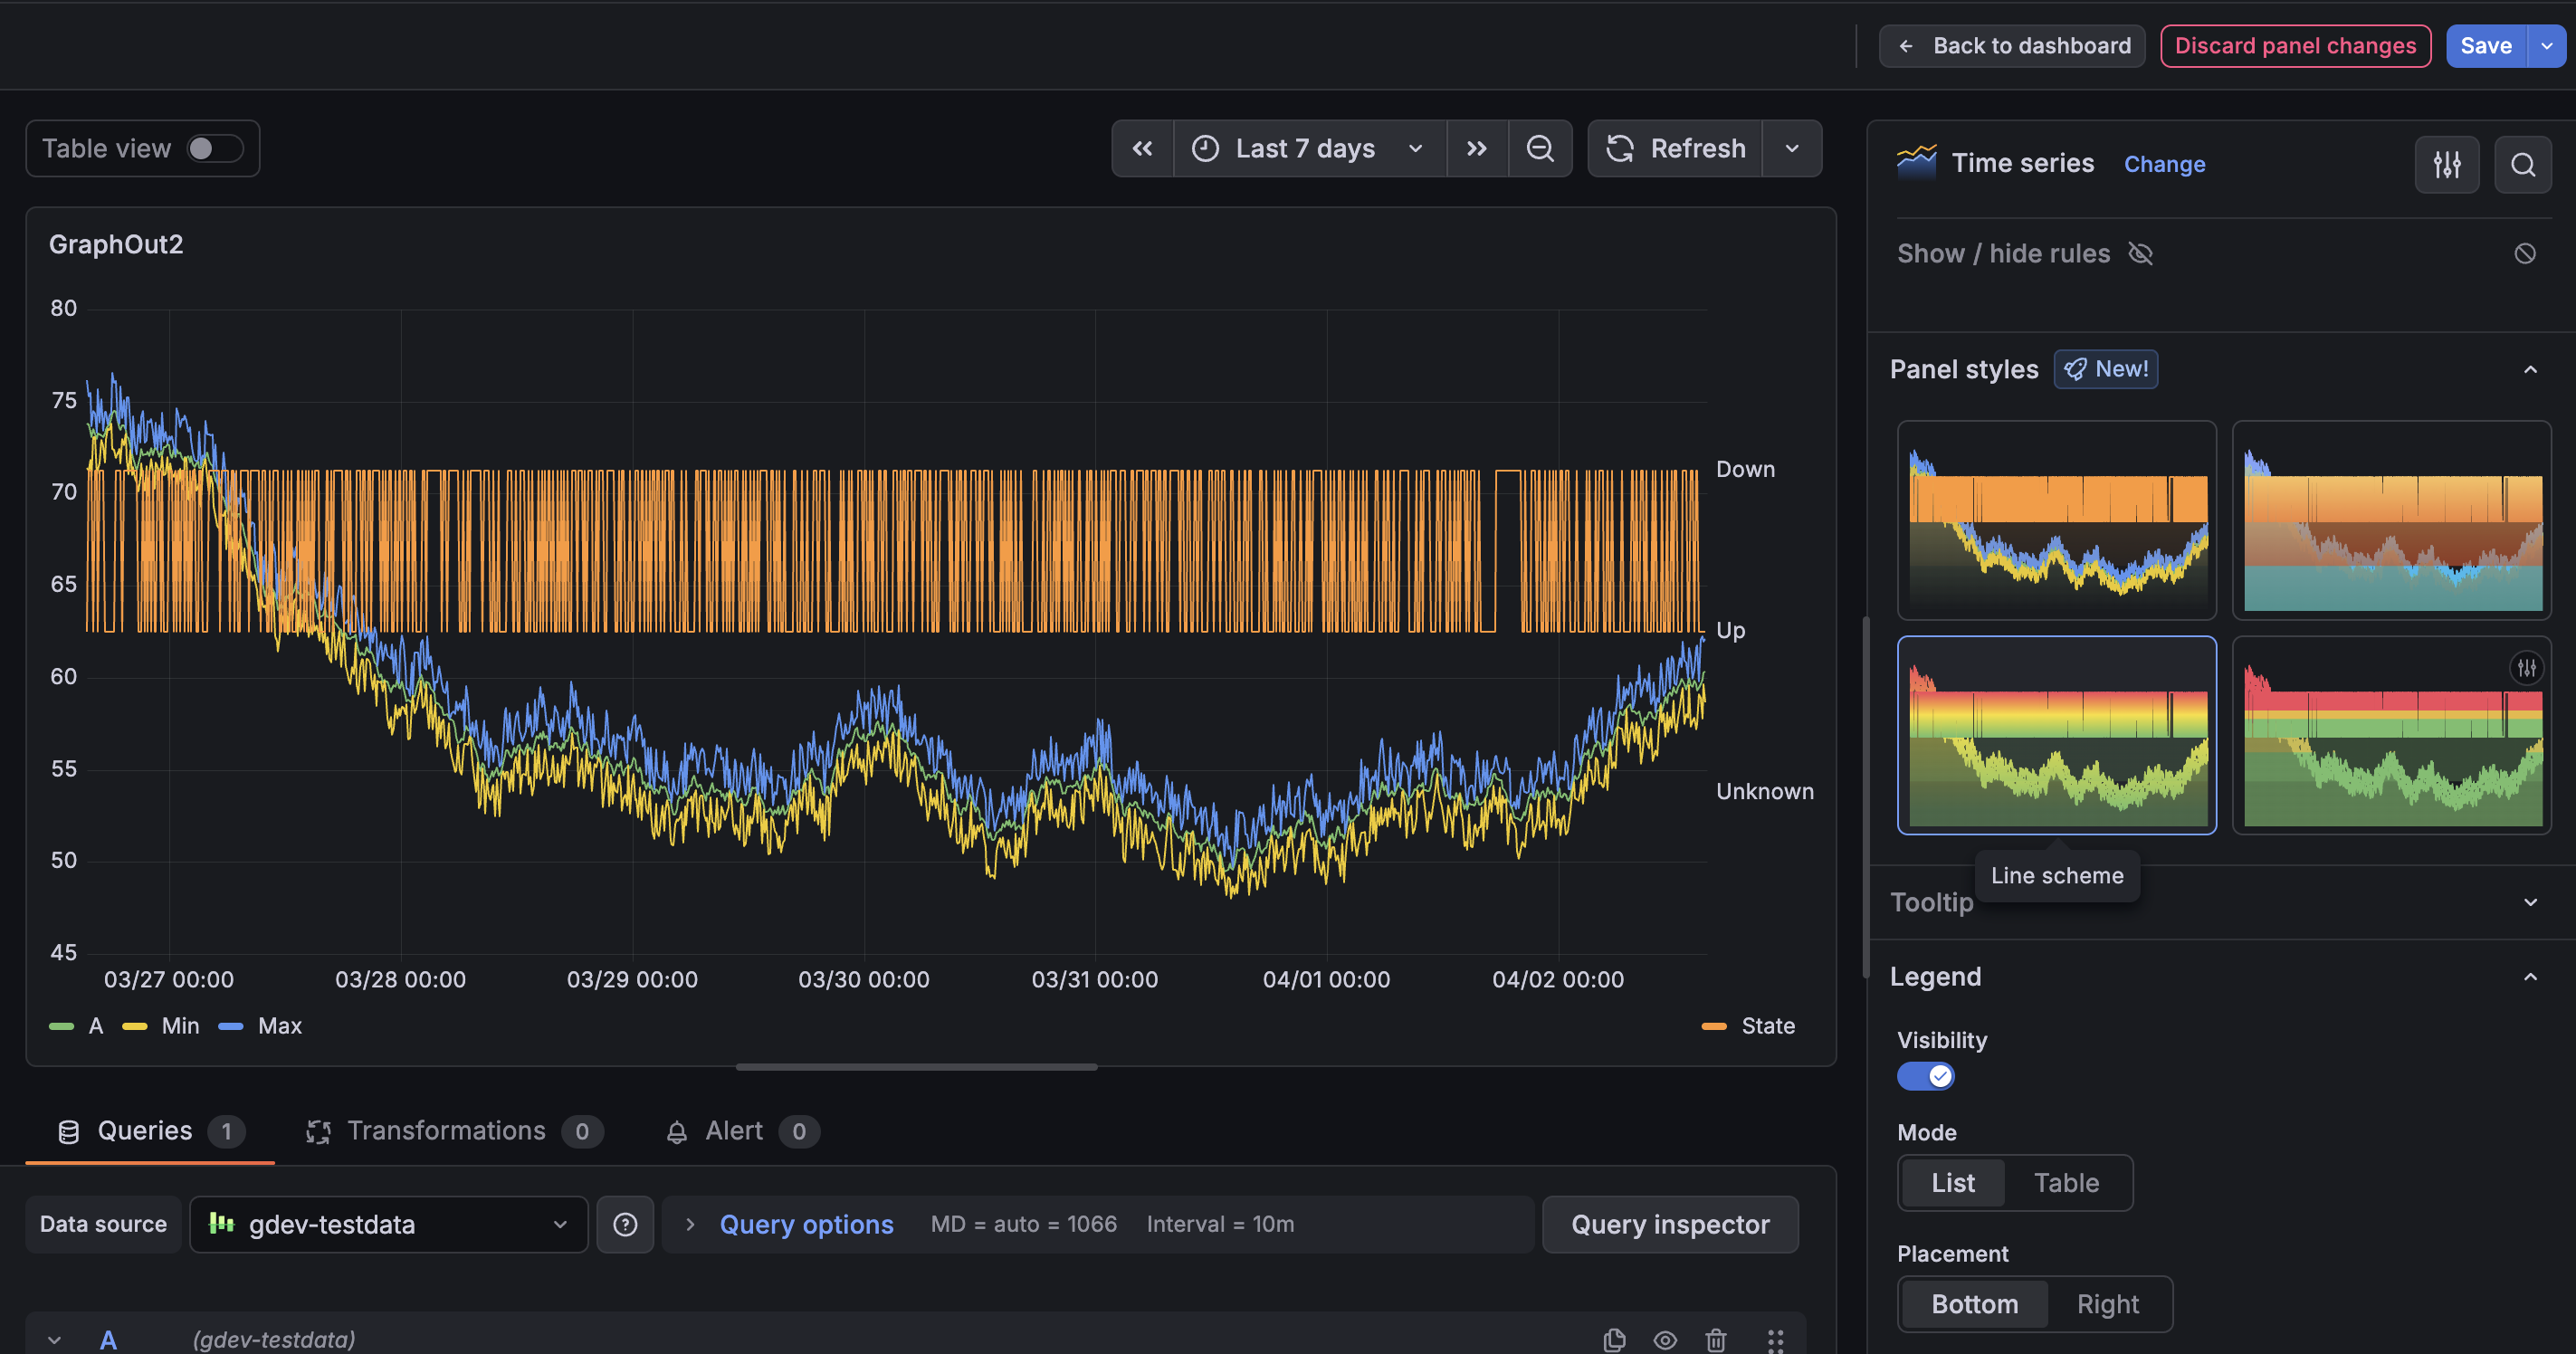
The panel styles we introduced earlier this year are now generally available in all editions of Grafana. Apply curated colors, thresholds, and display options to time series, stat, gauge, bar gauge, and bar chart panels with a single click in the panel editor.
Grafana CloudAvailable in public previewOpen sourceEnterpriseAvailable in public preview
Dashboards and visualizations
The table visualization’s nested rows feature has gotten some significant upgrades: a redesigned editor for the Group to nested tables transformation and the ability to apply field overrides to fields inside nested sub-tables.
Grafana CloudGeneral availabilityOpen sourceEnterpriseGeneral availability
Dashboards and visualizations
When a time series panel renders a long list of series, finding the ones you care about often means editing the query or scanning a crowded legend. The new Series visibility filter in the time series visualization lets you narrow visible series interactively— by name, by label, or both— without touching the underlying query.
Grafana CloudGenerally AvailableOpen sourceEnterpriseGenerally Available
Dashboards and visualizations
Earlier this year we announced the addition of section-level variables for rows and tabs. This feature is now generally available.
If your dashboard includes both an API gateway and a database, changing something like an $instance variable affects all panels at once. To avoid this, you might have to split services across separate dashboards, which defeats the goal of having a unified view.
Grafana CloudGenerally AvailableOpen sourceEnterpriseGenerally Available
Dashboards and visualizations
With the new dashboarding experience now generally available, we’ve introduced a series of UI enhancements that make dashboard creation and editing more discoverable, consistent, and easier to navigate.
Grafana CloudAvailable in public previewOpen sourceEnterpriseAvailable in public preview
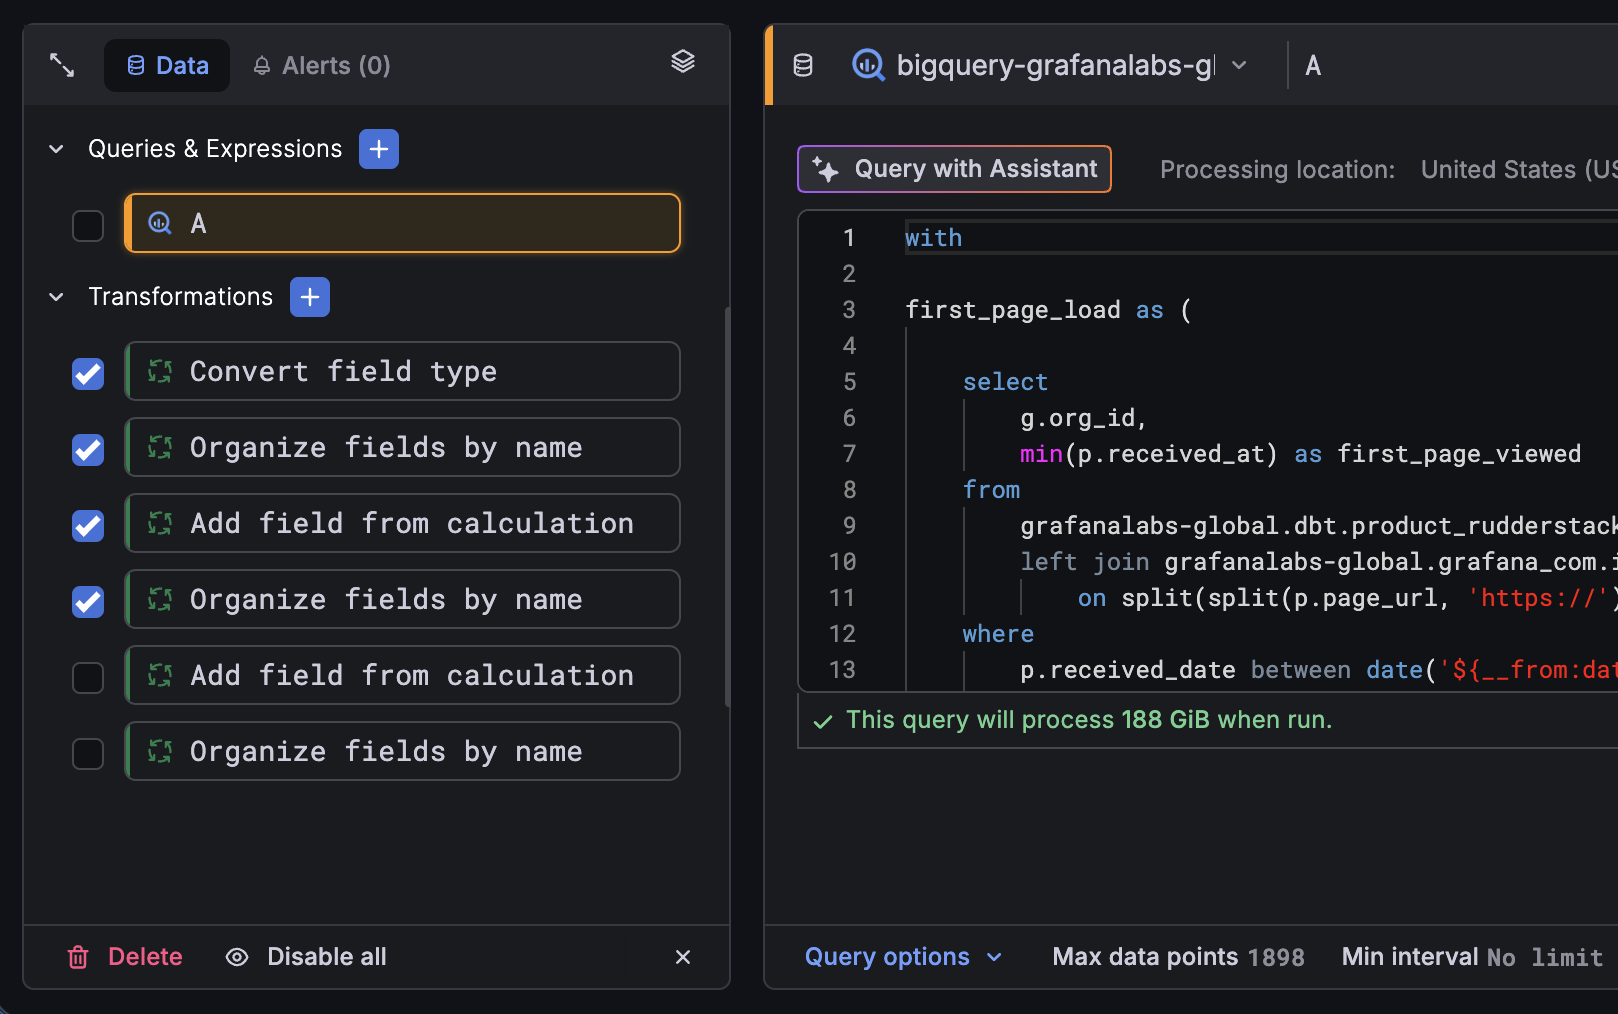
The revamped query editor experience is now in public preview. Since the initial private preview release, we’ve continued to refine the experience and added two new capabilities to help you work with complex panels even faster: multi-select with bulk actions and a stacked view.
Starting with Grafana 13.1, Grafana Assistant comes pre-installed in Grafana Enterprise, with no plugin installation required. If you’re a Grafana Enterprise user, simply connect your Grafana Cloud account to start using Assistant right away. Get onboarded quicker, explore telemetry data, build dashboards, and get things done faster using natural language.
Grafana CloudGenerally AvailableOpen sourceEnterpriseGenerally Available
Data sources
Grafana Assistant now supports eight new data sources
Grafana Assistant can now query Snowflake, MongoDB, Oracle, Elasticsearch, Dynatrace, Honeycomb, Zabbix, and Jira directly.
This means you can ask a single question and get answers that draw from across your observability stack, your databases, and your project tracking tools, without switching between systems. An investigation that starts with an alert can pull in error rates from Dynatrace, query performance from Oracle, and recent deployments from Jira, all in one conversation.
Grafana CloudGenerally AvailableEnterpriseGenerally Available
Data sources
Private Data Source Connect (PDC) adds support for three new data sources: MQTT, GitHub, and IBM Db2.
PDC creates a private, encrypted tunnel between your Grafana Cloud stack and data sources running inside private networks, VPCs, or on-premises environments. No public endpoint required.