
This is documentation for the next version of Grafana documentation. For the latest stable release, go to the latest version.

Logs Drilldown table view
The Table view in Grafana Logs Drilldown displays your logs in a table with a column for each displayed field, so you can scan structured logs the way you’d read a spreadsheet.
Use the table view when you want to scan, compare, and sort log data. For example, you can sort by duration to find the slowest requests, compare status codes or Pod names across many log lines.
To open the table view, select Show logs for your service in Logs Drilldown, then select the Table radio button in the panel header, next to Logs and JSON.
The Logs Table visualization
Note
The Logs Table visualization is currently in public preview. Grafana Labs offers limited support, and breaking changes might occur prior to the feature being made generally available.
To use this feature, enable the logsTablePanelNG feature toggle in your Grafana configuration file or contact Support.
When you enable the feature toggle, the Table view renders your logs with the native Grafana Logs Table visualization, described on this page.
Select and organize columns
Use the sidebar on the left of the table to choose which fields appear as columns. For example, to build a table with only the fields you care about:
- Select the Table view in the panel header.
- Click Search fields by name and enter a full or partial field name.
- Select the field’s checkbox to add it as a column, and clear the checkboxes of any columns you don’t need.
The sidebar offers the following controls:
To give the table more room, collapse the sidebar with the Collapse sidebar icon. You can also resize the sidebar, the columns, and the log details sidebar by dragging their edges. Logs Drilldown remembers your column selection and sizes.
View log details
Each row has a Show details eye icon at the start of the line.
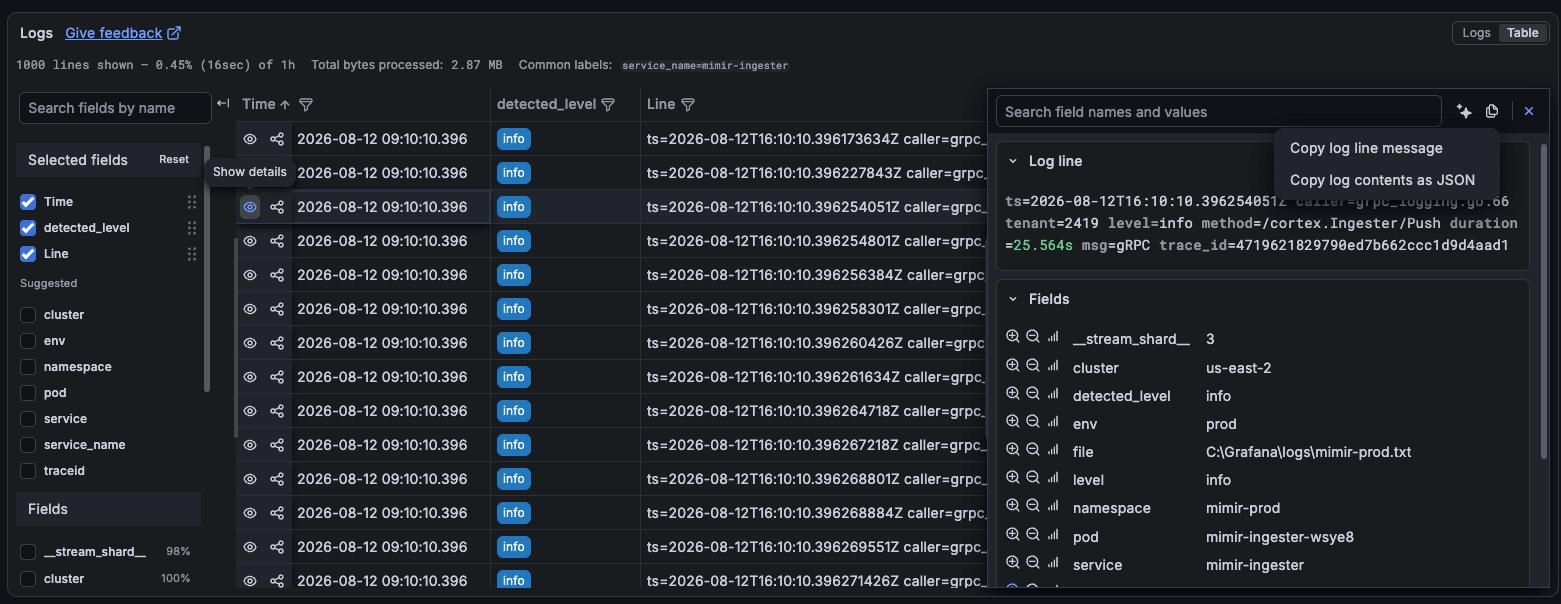
Select Show details to open the log details sidebar, where you can search fields, copy the log line, filter for or out field values, and view field statistics. Refer to View logs for explanations.
In the table view:
- Log details always open as a sidebar on the right, which you can resize or close with the Close log details sidebar icon or the Escape key.
- The copy icon at the top of the sidebar opens a menu with Copy log line message and Copy log contents as JSON options, as shown in the previous image.
- Opening details for several rows creates a tab for each log line, so you can compare them.
- Use the up and down arrow keys to move the details view to the previous or next log line.
Rows also have a Copy link to log line icon that copies a short link to that log line to your clipboard.
Filter, sort, wrap, and download
The table view uses the columns themselves for filtering, plus a controls rail on the right edge of the panel.
Filter by level and by value
Every column header has a Filter icon, which opens a list of that column’s values to filter by. To filter by log level, use the Filter icon on the level column, for example detected_level.
You can also hover over any cell and use Filter for value or Filter out value to add that value to your query, or filter from within log details. The Log levels filter in the Logs Drilldown toolbar applies to the table view as well.
Sort
Click a column header to sort by that column, and click again to flip the direction. The sort order control in the rail switches between newest and oldest logs first, and stays in sync with the time column.
Wrap text
Select the wrap control in the rail to toggle text wrapping for long log lines and cell values.
Download
Use the Download logs control in the rail to export the displayed logs as txt, json, or csv.
The export includes the columns you’ve selected. In dashboards, the download control appears when you enable the Display download control panel option.
Where features moved
If you’re coming from the previous table view in Logs Drilldown or Grafana Explore, here’s where features moved in the Logs table visualization:
Was this page helpful?
Related resources from Grafana Labs



