
This is documentation for the next version of Grafana documentation. For the latest stable release, go to the latest version.
 Grafana documentation
Visualize data
Panels and visualizations
Query and transform data
SQL expressions
Grafana documentation
Visualize data
Panels and visualizations
Query and transform data
SQL expressionsSQL expressions
SQL Expressions are server-side expressions that manipulate and transform the results of data source queries using MySQL-like syntax. They allow you to easily query and transform your data after the data source returns it, using SQL, which provides a familiar and powerful syntax that can handle everything from simple filters to highly complex, multi-step transformations.
In Grafana, a server-side expression is a way to transform or calculate data after Grafana retrieves it from the data source, but before Grafana sends it to the frontend for visualization. Grafana evaluates these expressions on the server, not in the browser or at the data source.
For general information on Grafana expressions, refer to Write expression queries.
Note
The screenshots and steps on this page reflect the classic, generally available panel query editor. For information about the new panel query editor experience, currently in public preview, refer to the Query and transform data documentation.
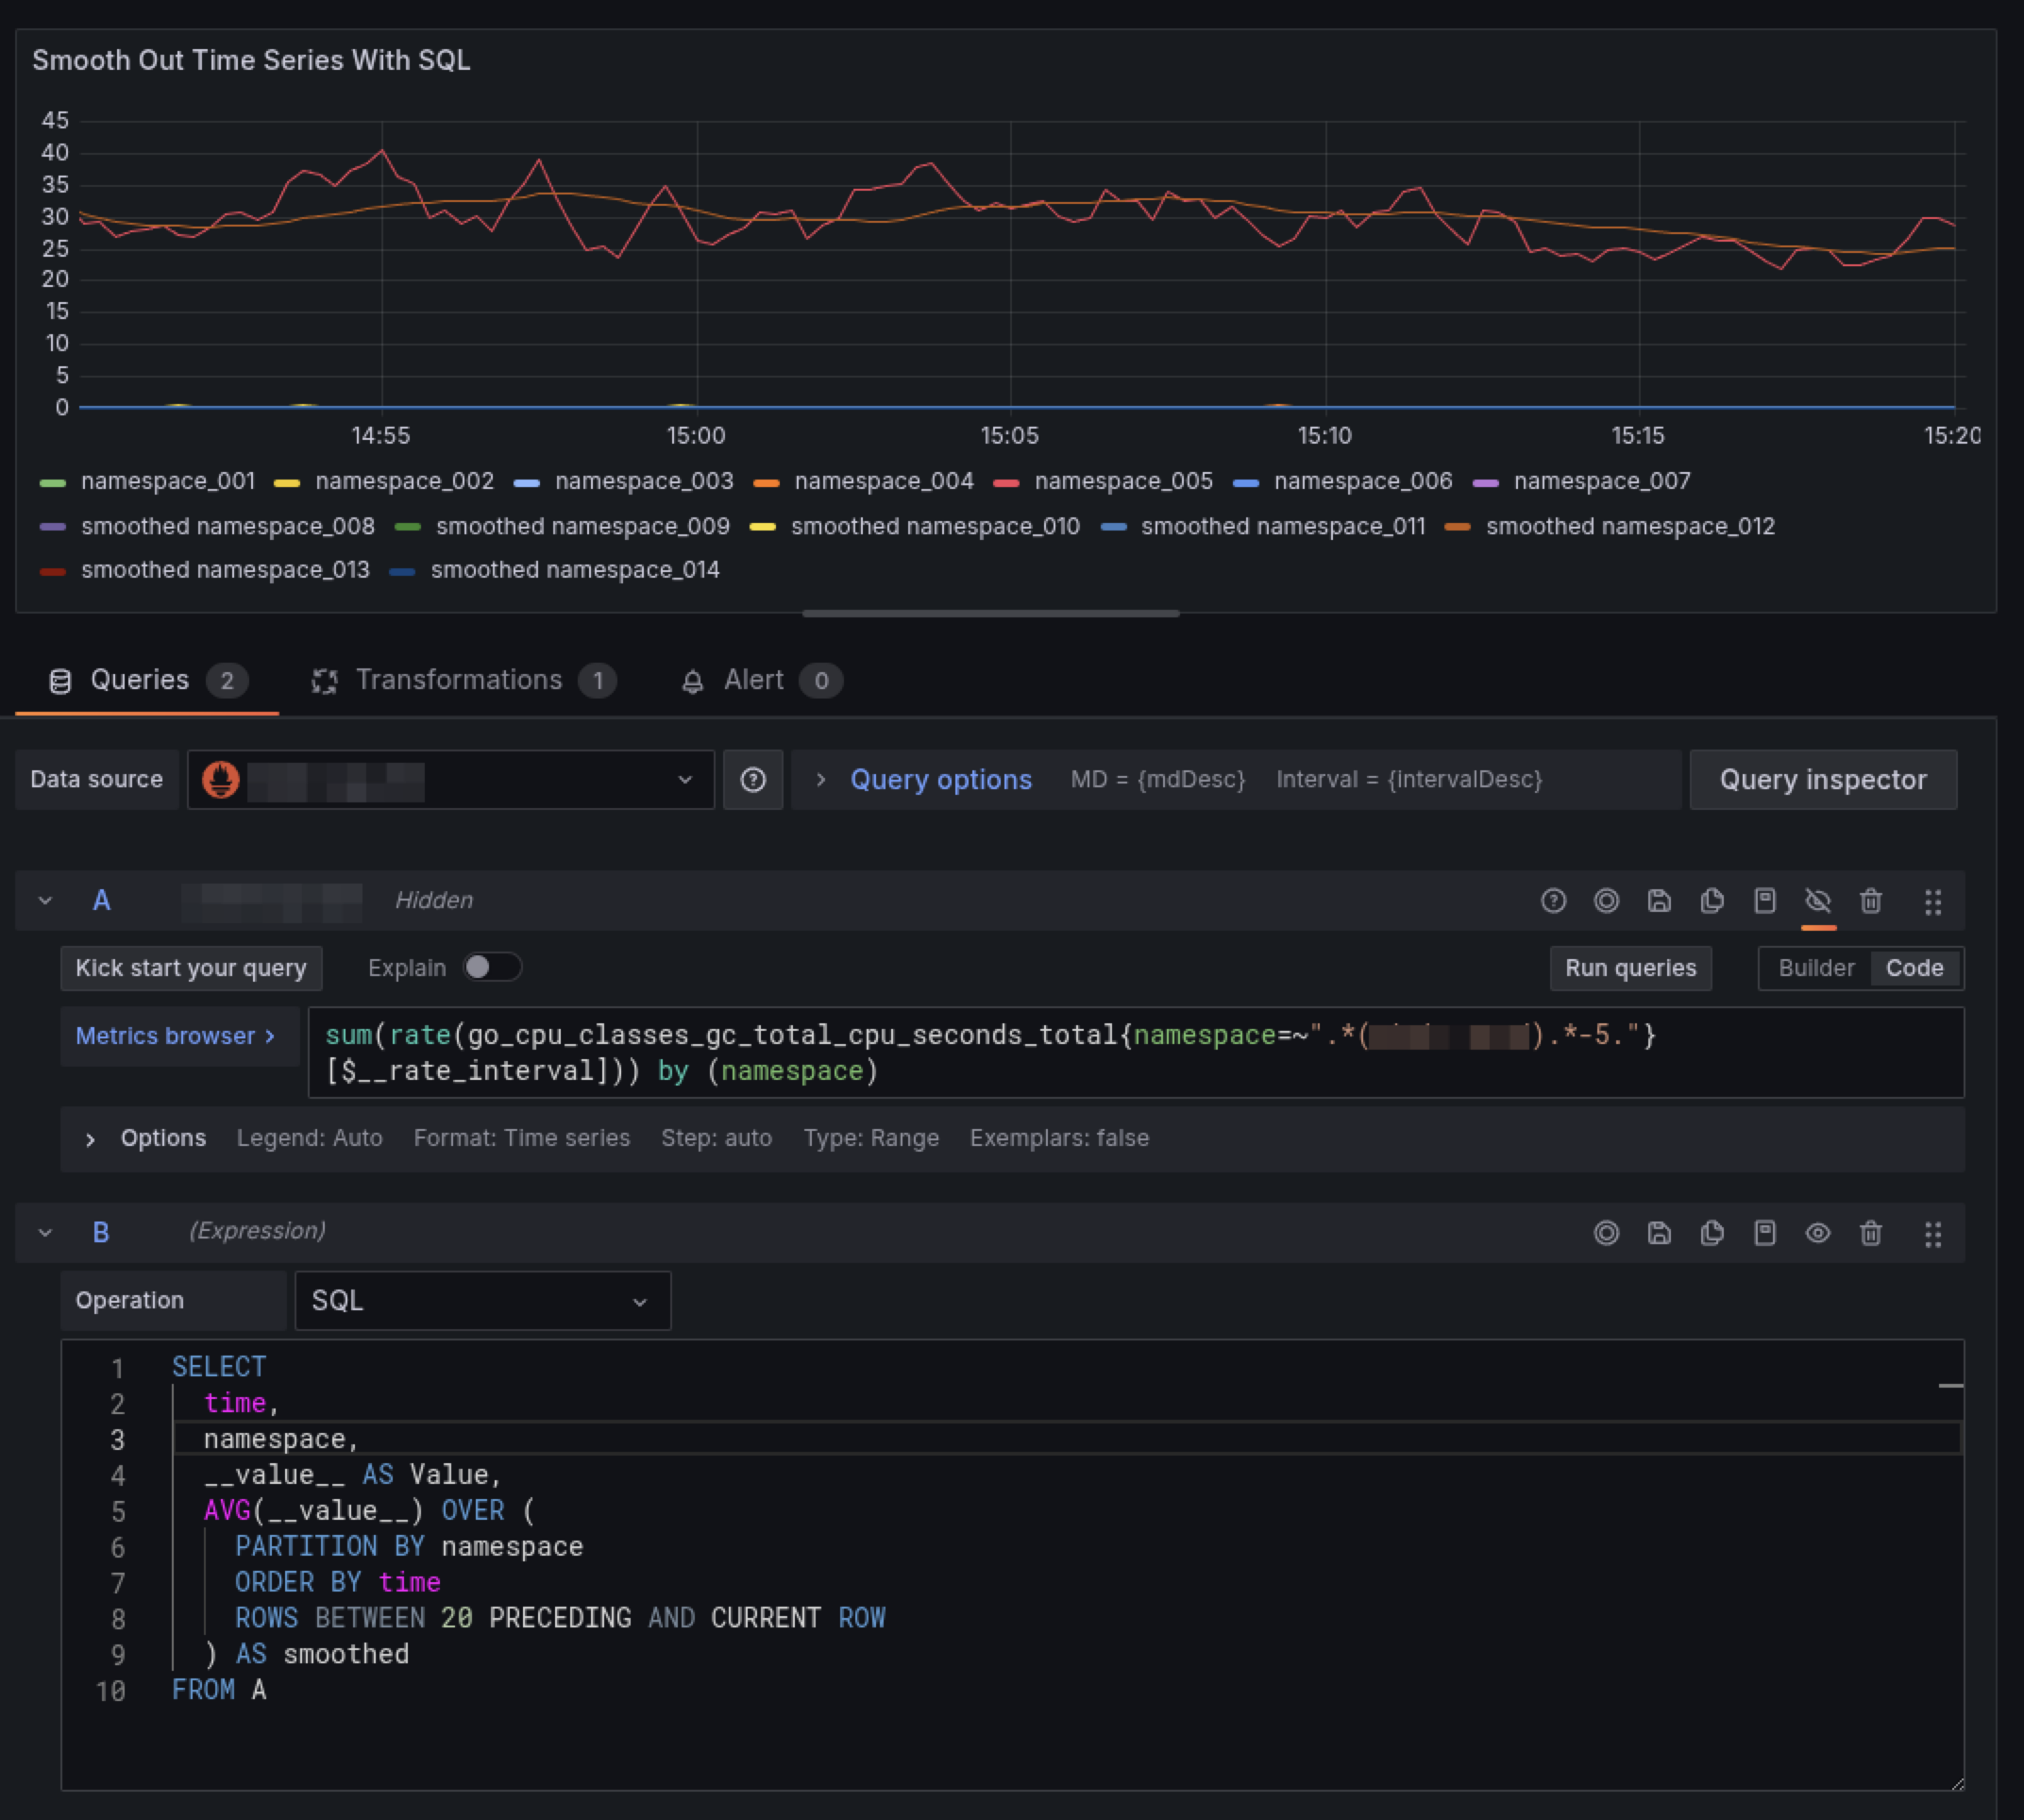
Before you begin
- Grafana enables SQL expressions by default. You don’t need to set a feature toggle or change your configuration to use them.
- You must query a backend data source. SQL expressions don’t work with frontend-only data sources.
Transform data with SQL expressions
SQL expressions allow you to:
- Shape, transform, and modify query results without changing the original query.
- JOIN data from multiple tables.
- Create alerts or recording rules based on transformed data.
- Perform final-stage modifications to datasets, including:
- Show, hide, or rename columns.
- Filter rows based on conditions.
- Aggregate data (for example: sum, average, count).
- Write subqueries and Common Table Expressions (CTEs) to support more complex logic:
- Subqueries are nested queries used for filtering, calculations, or transformations.
- CTEs are temporary named result sets that help make complex queries more readable and reusable.
A key capability of SQL expressions is the ability to JOIN data from multiple tables. This allows users to combine and transform data in a predictable, user-friendly way—even for complex use cases. You can JOIN data from many data source queries, subject to the input cell limit.
To work with SQL expressions, you must use data from a backend data source. In Grafana, a backend data source refers to a data source plugin or integration that communicates with a database, service, or API through the Grafana server, rather than directly from the browser (frontend).
Frontend-only data sources, such as the Dashboard data source, aren’t supported. Use one of the compatible data sources listed below for queries that you want to reference in a SQL expression.
Compatible data sources
The following are compatible data sources:
Full support: Grafana supports all query types for each of these data sources.
- Elasticsearch
- MySQL
- Loki
- Graphite
- Google Sheets
- Amazon Athena
- PostgreSQL
Partial support: The following data sources have limited or conditional support. Some support multiple query types depending on the service. For example, Azure Monitor can query multiple services, each with its own query format. In some cases, you can also switch the query type within a panel.
- InfluxDB
- Infinity
- Azure Monitor
- TestData
- Tempo
- Prometheus
- CloudWatch
- GitHub
- BigQuery
Create SQL expressions
To create a SQL expression, complete the following steps:
- Navigate to Dashboards in the left-side menu.
- Select a dashboard and open a dashboard panel.
- Click the ellipsis in the upper right and select Edit .
- Click + Expression.
- Select SQL from the drop-down.
After you have added a SQL expression, you can select from other data source queries by referencing the RefIDs of the queries in your SQL expression as if they were tables in a SQL database.
Note
The RefID is a unique identifier assigned to each query within a Grafana panel that serves as a reference name for that query’s data.
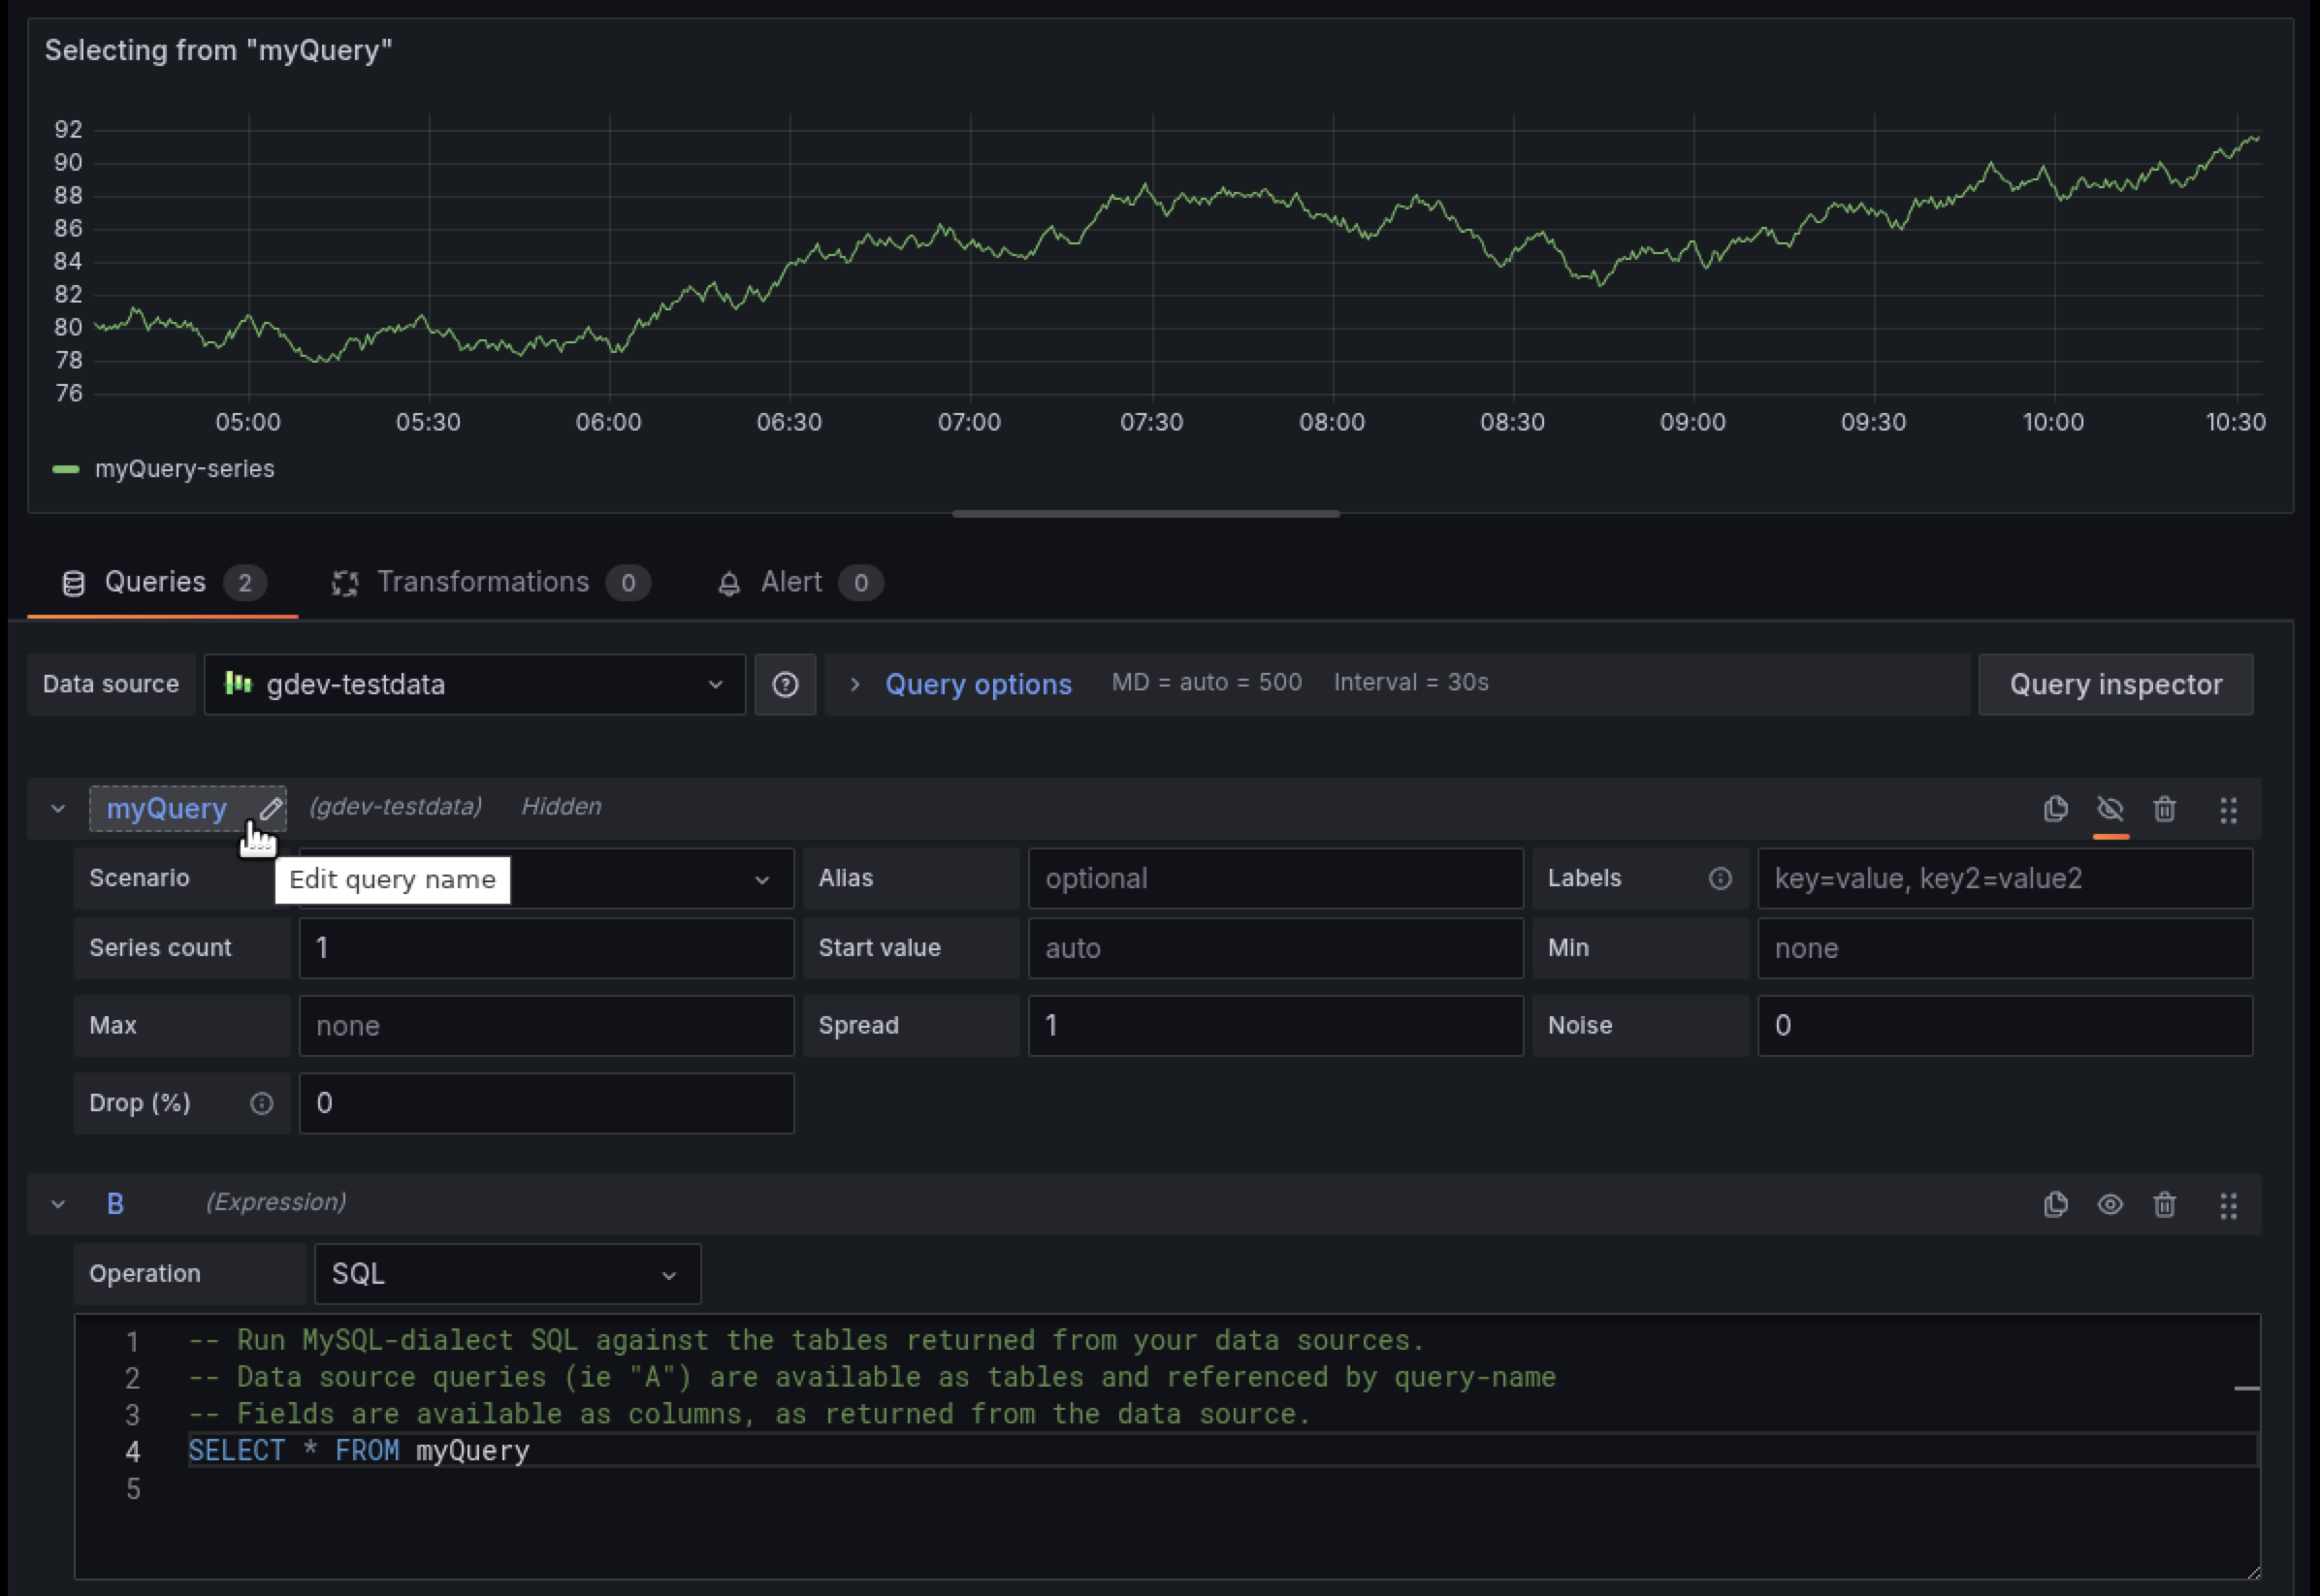
Workflow to build SQL expressions
Use the following workflow to create a SQL expression:
Build your base queries. Create the individual query and give it a meaningful name. Create the queries (A, B, etc.) that provide the data you want to combine or transform using SQL Expressions.
Hide your base queries. Click the 👁️ Eye icon next to each base query to hide them from visualization. This keeps your panel clean while still making the data available to the SQL Expression.
Switch to table view. Set the panel visualization to Table to inspect and review the structure and output of your SQL expression as you build and refine it.
Add a SQL Expression. Add a new query and add select SQL Expression as its type.
Inspect inputs. Start with simple test queries to understand the shape of your input frames.SELECT * FROM A LIMIT 10This lets you see the available columns and sample rows from
query A. Repeat this for each input query you want to use (for example,SELECT * FROM B LIMIT 10).Inspect your data. Repeat this for each input query to understand the column structure and data types you’re working with.
SELECT * FROM <B, C, D, etc> LIMIT 10Construct the SQL expression. After you understand your data, you can write your SQL expression to join, filter, or otherwise transform the data.
Validate and iterate. Click Refresh every time you update your SQL query to re-evaluate and see the updated result.
When selecting a visualization type, ensure your SQL expression returns data in the required shape. For example, time series panels require a column with a time field (such as a timestamp) and a numeric value column (such as __value__). If the output is not shaped correctly, your visualization may appear empty or fail to render.
The SQL expression workflow in Grafana has the following behaviors:
Unhidden queries are visualized automatically. If an input query is not hidden, Grafana will attempt to render it alongside your SQL expression. This can clutter the output, especially in table visualizations.
SQL expression results may not be immediately visible. You might need to use the data frame selector (dropdown at the bottom of the table panel) to switch between the raw query and the SQL expression result.
Non-tabular or incorrectly shaped data will not render in certain panels. Visualizations such as graphs or gauges require properly structured data. Mismatched formats will result in rendering issues or missing data.
The SQL expression editor
The SQL expression editor provides several tools to help you write and run queries.
- Run query: Runs your SQL expression and refreshes the result. You can also press Ctrl+Enter, or Cmd+Enter on macOS, while your cursor is in the editor.
- Format query: Formats your SQL for readability while preserving template variables.
- Copy query: Copies the current SQL to your clipboard.
The editor autocompletes SQL keywords, supported functions, and the RefIDs of your other queries as table names. Column autocomplete is experimental and requires the sqlExpressionsColumnAutoComplete feature toggle. When enabled, the editor suggests column names by querying your data sources for their fields.
Note
An enhanced editor built on CodeMirror is available on an experimental basis behind the
sqlExpressionsCodeMirrorfeature toggle. It adds function signature help and context-aware column suggestions, such as resolving table aliases.
Schema inspector
When you enable the query service API on your instance, the editor includes a Schema inspector side panel. Click the eye icon next to the editor to show or hide it.
The Schema inspector has a tab for each source query and lists the following details for every column, so you can reference the correct field names and types as you write your SQL:
- Field: The column name.
- Type: The MySQL data type.
- Nullable: Whether the column can contain null values.
- Sample values: Example values from the query result.
SQL expressions examples
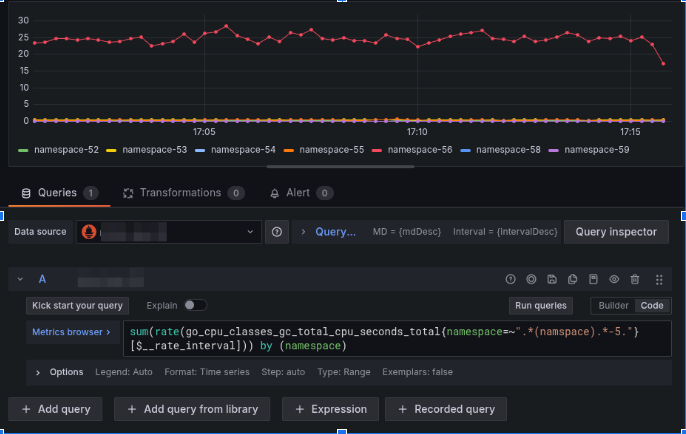
Create the following Prometheus query:
sum(
  rate(go_cpu_classes_gc_total_cpu_seconds_total{namespace=~".*(namespace).*5."}[$__rate_interval])
) by (namespace)
The panel displays the CPU usage by Go garbage collection (GC) over time, broken down by namespace.
![Example using a Prometheus query]()
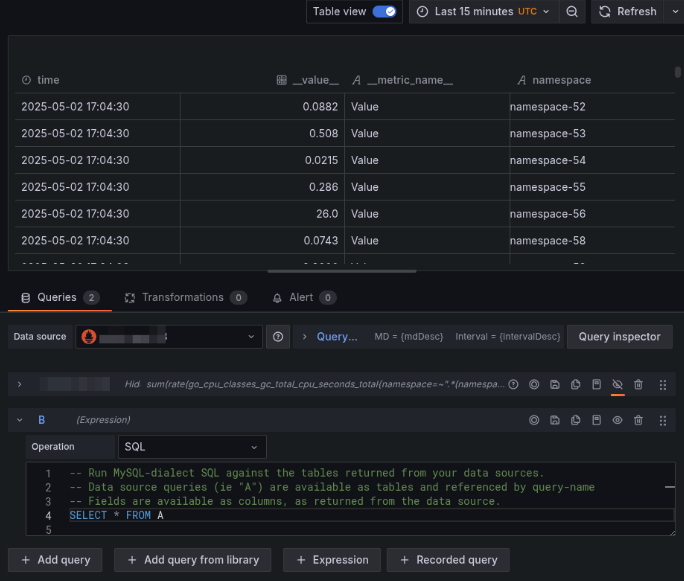
Add the SQL expression
SELECT * from A. After you add a SQL expression that selects from RefID A, Grafana converts it to a table response:![Add the SQL expression]()
SQL conversion rules
When you reference a RefID within a SQL statement (for example, SELECT * FROM A), the system invokes a distinct SQL conversion process.
The SQL conversion path:
- The query result appears as a single data frame, without labels, and maps directly to a tabular format.
- If the frame type is present and is either numeric, wide time series, or multi-frame time series (for example: labeled formats), Grafana automatically converts the data into a table structure.
Data source response formats
Grafana supports three types of data source response formats:
Single Table-like Frame:
This refers to data returned in a standard tabular structure that organizes all values into rows and columns, similar to what you’d get from a SQL query.- Example: Any query against a SQL data source (for example, PostgreSQL, MySQL) with the format set to Table.
Dataplane: Time Series Format:
This format represents time series data with timestamps and associated values. It is typically returned from monitoring data sources.- Example: Prometheus or Loki Range Queries (queries that return a set of values over time).
Dataplane: Numeric Long Format:
This format represents point-in-time (instant) metric queries that return a single value (or a set of values) at a specific moment.- Example: Prometheus or Loki Instant Queries (queries that return the current value of a metric).
For more information on these formats, refer to the Grafana Dataplane documentation.
The following non-tabular formats are automatically converted to a tabular format (FullLong) when used in SQL expressions:
- Time Series Wide: Label keys become column names.
- Time Series Multi: Label values become the values in each row (or null if a label is missing).
- Numeric Wide: The
__value__column contains the numeric metric value. - Numeric Multi: If a display name exists, it will appear in the
__display_name__column.
During conversion:
- Label keys become column names.
- Label values populate the corresponding rows (null if a label is missing).
- The
__value__column contains the numeric metric. - If available, the
__display_name__column contains a human-readable name. - The
__metric_name__column stores the raw metric identifier. - For time series data, Grafana includes a
timecolumn with timestamps
Supported functions
Grafana maintains a complete list of supported SQL keywords, operators, and functions in the SQL expressions query validation code.
For the most up-to-date reference of all supported SQL functionality, refer to the allowedNode and allowedFunction definitions in the Grafana codebase.
Alerting and recording rules
SQL expressions integrates alerting and recording rules, allowing you to define complex conditions and metrics using standard SQL queries. The system processes your query results and automatically creates alert instances or recorded metrics based on the returned data structure.
For SQL Expressions to work properly with alerting and recording rules, your query must return:
- Exactly one numeric column - required. This contains the value that triggers alerts or gets recorded. The query fails if it returns no numeric column or more than one.
- Unique string column combinations - required. Each row must have a unique combination of string column values.
- One or more string columns - optional. These become labels for the alert instances or metrics. Examples:
service,region.
Consider the following query results:
error_count,service,region
25,auth-service,us-east
0,payment-service,us-west
15,user-service,eu-west
This query returns:
- the numeric column
error_count(values: 25, 0, 15) - the string columns
serviceandregion
For alert rules, this creates three alert instances:
- First instance with labels {service=auth-service, region=us-east} and value 25 (triggers alert - high error count)
- Second instance with labels {service=payment-service, region=us-west} and value 0 (no alert - zero errors)
- Third instance with labels {service=user-service, region=eu-west} and value 15 (triggers alert - elevated error count)
For recording rules, creates one metric with three series:
- First series: error_count_total{service=auth-service, region=us-east} 25
- Second series: error_count_total{service=payment-service, region=us-west} 0
- Third series: error_count_total{service=user-service, region=eu-west} 15
Following are some best practices for alerting and recording rules:
- Keep numeric values meaningful (for example: error counts, request duration).
- Use clear, descriptive column names - these become your labels.
- Keep string values short and consistent.
- Avoid too many unique label combinations, as this can result in high cardinality.
- Always use
GROUP BYto avoid duplicate label errors. - Aggregate numeric values logically (for example:
SUM(error_count)).
Known limitations
- Grafana supports certain data sources. Refer to compatible data sources for a current list.
- A SQL expression can only reference data source queries. It can’t reference other expressions, and you can’t use the output of a SQL expression as the input to another expression.
- You can use only one SQL expression per panel or alert.
- Each SQL expression query must include a time range.
- SQL expressions aren’t supported on 32-bit ARM builds of Grafana.
- Autocomplete is available, but column and field autocomplete requires the experimental
sqlExpressionsColumnAutoCompletefeature toggle.
Query limits
Grafana enforces the following limits on SQL expressions. Administrators can configure them in the [expressions] section of the Grafana configuration. For more information, refer to
Configure Grafana.
- Input cells: The total number of cells, that is rows multiplied by columns, across all referenced queries can’t exceed
sql_expression_cell_limit. The default is100000. If the input exceeds this limit, the query fails. - Output cells: The number of cells returned can’t exceed
sql_expression_output_cell_limit. The default is100000. If the output exceeds this limit, Grafana truncates the result and returns a warning. - Query length: The SQL text can’t exceed
sql_expression_query_length_limitcharacters. The default is10000. - Timeout: Grafana cancels a SQL expression that runs longer than
sql_expression_timeout. The default is10s.
For each limit, a value of 0 means no limit.
Regular expression limitations in SQL expressions
SQL expressions run on an embedded SQL engine that evaluates regular expressions with Go’s standard regexp package, which uses RE2 syntax instead of the SQL engine’s full MySQL-compatible regular expressions. As a result, some regular expression features aren’t available.
SQL expressions that use regular expression functions have limitations such as:
- Lack of back-references.
- No lookahead or lookbehind assertions.
- Differences in handling carriage return (
\r) characters.
There may be other minor differences as well.
Schema changes and missing data
SQL expressions have known limitations that may cause queries to fail or return unexpected results. These constraints are inherent to how the feature works, so keep them in mind when you build queries.
These limitations affect the following situations:
Error responses: When a data source query returns an error, SQL expressions cannot interpret the result.
No data responses: If a query returns no rows, the SQL expression engine cannot infer a schema.
Dynamic schema responses: If the set of columns or labels changes between query executions, SQL expressions may fail because it treats column changes as schema changes.
An embedded SQL engine powers SQL expressions, treating each query result as a table. Grafana derives the schema of that table from the columns that the underlying data source returns.
Unlike traditional SQL databases, where schemas are usually fixed, many Grafana data sources (for example, Prometheus) can return results with varying label sets or no data at all.
When this happens:
- A missing column appears to the SQL engine as if it doesn’t exist.
- A completely empty result provides no schema for subsequent SQL operations.
- Error responses break the assumption that the query returns tabular data.
As a result, SQL expressions can’t gracefully handle changes in schema or no-data conditions, since these cases violate the static schema model that SQL relies on.
Workarounds
You can mitigate these issues in the following ways:
Avoid
SELECT *: Explicitly select only the columns you expect to exist.Ensure a consistent schema: If possible, configure your query to always return columns, even when no data is present.
Example: Handling Prometheus no data
When joining results from the same Prometheus query across different data source instances, you can use this pattern:
-- Prometheus query
sum by (cluster) (up{job=~".*zruler.*"})
or on (cluster) (
  (0/0) *
  (
    label_replace(vector(1), "cluster", "fake", "", "")
  )
)

-- SQL expression
SELECT
    COALESCE(a.time, b.time) AS time,
    COALESCE(a.cluster, b.cluster) AS cluster,
    COALESCE(a.up, 0) + COALESCE(b.up, 0) AS unified_up
FROM (
    SELECT time, cluster, __value__ AS up
    FROM A
    WHERE cluster != 'fake'
    ORDER BY time
    LIMIT 5
) a
FULL OUTER JOIN (
    SELECT time, cluster, __value__ AS up
    FROM B
    WHERE cluster != 'fake'
    ORDER BY time
    LIMIT 5
) b ON a.time = b.time;
This approach ensures that a schema exists even when one query returns no data.
Grafana Assistant integration
Grafana Assistant brings AI-powered assistance to your SQL expressions workflow. Assistant knows SQL expressions, so it can explain a query, fix syntax errors, and suggest improvements using the correct MySQL-dialect syntax, table references, and column conventions.
You can also ask Assistant to build a panel using natural language. When you ask it to combine or correlate data across multiple queries, it prefers SQL expressions over join transformations and writes the SQL expression directly into your panel.
Note
Grafana Assistant is generally available on Grafana Cloud and in public preview for Grafana OSS and Grafana Enterprise. On Grafana Enterprise (version 13.1 and later), Assistant comes pre-installed, so you only need to connect your Grafana Cloud account to start using it. On Grafana OSS, install the Assistant app from the plugin catalog and connect it to a Grafana Cloud stack. For more information, refer to the Grafana Assistant documentation.
When Grafana Assistant is available on your instance, the SQL expression editor shows Assistant buttons to the right of the Run query button. When you use a button, Assistant opens in the sidebar with your SQL query, any query errors, and your schema column metadata already included as context, so it can reference the actual field names and types in your data. From there you get the full Assistant experience, including follow-up questions, conversation history, and access to the Assistant’s built-in tools.
- Explain query: Describes what your query does, including its interpreted meaning.
- Improve query: Suggests performance, reliability, and readability enhancements, and fixes syntax errors. If you haven’t written a query yet, this appears as Generate suggestion and proposes a starting query, such as a join, aggregation, filter, percentile, or time-based window function, using your available queries.
Was this page helpful?
Related resources from Grafana Labs



