
This is documentation for the next version of Grafana documentation. For the latest stable release, go to the latest version.

Panel overview
A Grafana panel is a visual representation of data composed of a query and a visualization. Within panels, you can apply transformations, which process the results of a query before they’re passed on for visualization. You can also further customize a panel by formatting data and configuring visualization options.
Each panel has a query editor specific to the data source selected in the panel. The query editor allows you to build a query that returns the data you want to visualize.
Panels offer a wide variety of formatting and styling options, from applying colors based on field values to creating custom units. Each visualization also comes with options specific to it that give you further control over how your data is displayed. Panels can also be dragged, dropped, and resized to rearrange them on the dashboard.
To get started adding panels, ensure that you have configured a data source:
For details about using data sources, refer to Data sources.
For more information about managing data sources as an administrator, refer to Data source management.
Note
Data source management is only available in Grafana Enterprise and Grafana Cloud.
Panel feature overview
The following image and descriptions highlight the panel features:
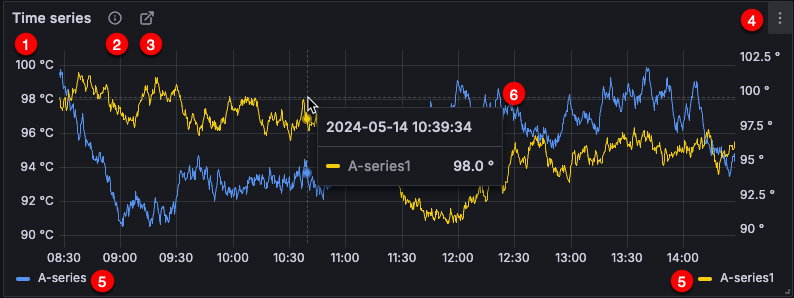
- Panel title - You can create your own panel titles or have Grafana create them for you using generative AI features.
- Panel description - You can create your own panel descriptions or have Grafana create them for you using generative AI features
- Links - Add panel links to other dashboards, panels, or external sites.
- Panel menu - In the panel menu, access actions such as View, Edit, Inspect, and Remove.
- Legend - Change series colors, y-axis, and series visibility directly from the legend.
- Tooltips - View tooltips to get more information about data points.
Panel menu
To access the panel editor, hover the cursor over the top-right corner of any panel. Click the panel menu icon that appears and select Edit.
The panel menu also gives you access to several actions. If an option is only available in view mode or edit mode, that’s indicated:
- View: View the panel in full screen. Opens the View panel sidebar and displays controls for supported visualizations, if enabled.
- Edit: Open the panel editor to edit panel and visualization options.
- Share: Share the panel as a link, embed, or snapshot.
- Explore: Open the panel in Explore, where you can focus on your query.
- Inspect: Open the Inspect drawer, where you can review the panel data, stats, metadata, JSON, and query.
- Data: Open the Inspect drawer in the Data tab.
- Query: Open the Inspect drawer in the Query tab.
- Panel JSON: Open the Inspect drawer in the JSON tab.
- Time settings: Opens the Panel time settings drawer where you can set panel-specific time options. For more information, refer to Panel time settings.
- Styles: Edit mode only. Copy and paste styles from one panel to another in the same dashboard. For more information, refer to Copy and paste panel styles.
- Assistant: View mode only. Access Grafana Assistant help options. This option is only available on Grafana Cloud.
- Metrics drilldown: Open the panel in the Drilldown > Metrics feature for further exploration. For more information, refer to Metrics drilldown.
- Extensions: View mode only. Access other actions provided by installed applications, such as declaring an incident. This option is only available in view mode and only appears if you have app plugins installed that contribute an extension to the panel menu.
- More: Access other panel actions.
- Duplicate: Edit mode only. Make a copy of the panel. Duplicated panels query data separately from the original panel. You can use the special
Dashboarddata source to share the same query results across panels instead. - Copy: Copy the panel to the clipboard.
- New library panel: Edit mode only. Create a panel that can be imported into other dashboards.
- New alert rule: Open the alert rule configuration page in Alerting, where you can create a Grafana-managed alert based on the panel queries.
- Hide/Show legend: Hide or show the panel legend.
- Get help: Send a snapshot or panel data to Grafana Labs Technical Support.
- Duplicate: Edit mode only. Make a copy of the panel. Duplicated panels query data separately from the original panel. You can use the special
- Remove: Edit mode only. Remove the panel from the dashboard.
View mode panel controls
Note
View panel sidebar is currently in public preview. Grafana Labs offers limited support, and breaking changes might occur prior to the feature being made generally available.
This feature is enabled by default. To turn it off, disable the
viewPanelPanefeature toggle in your Grafana configuration file or contact Support.
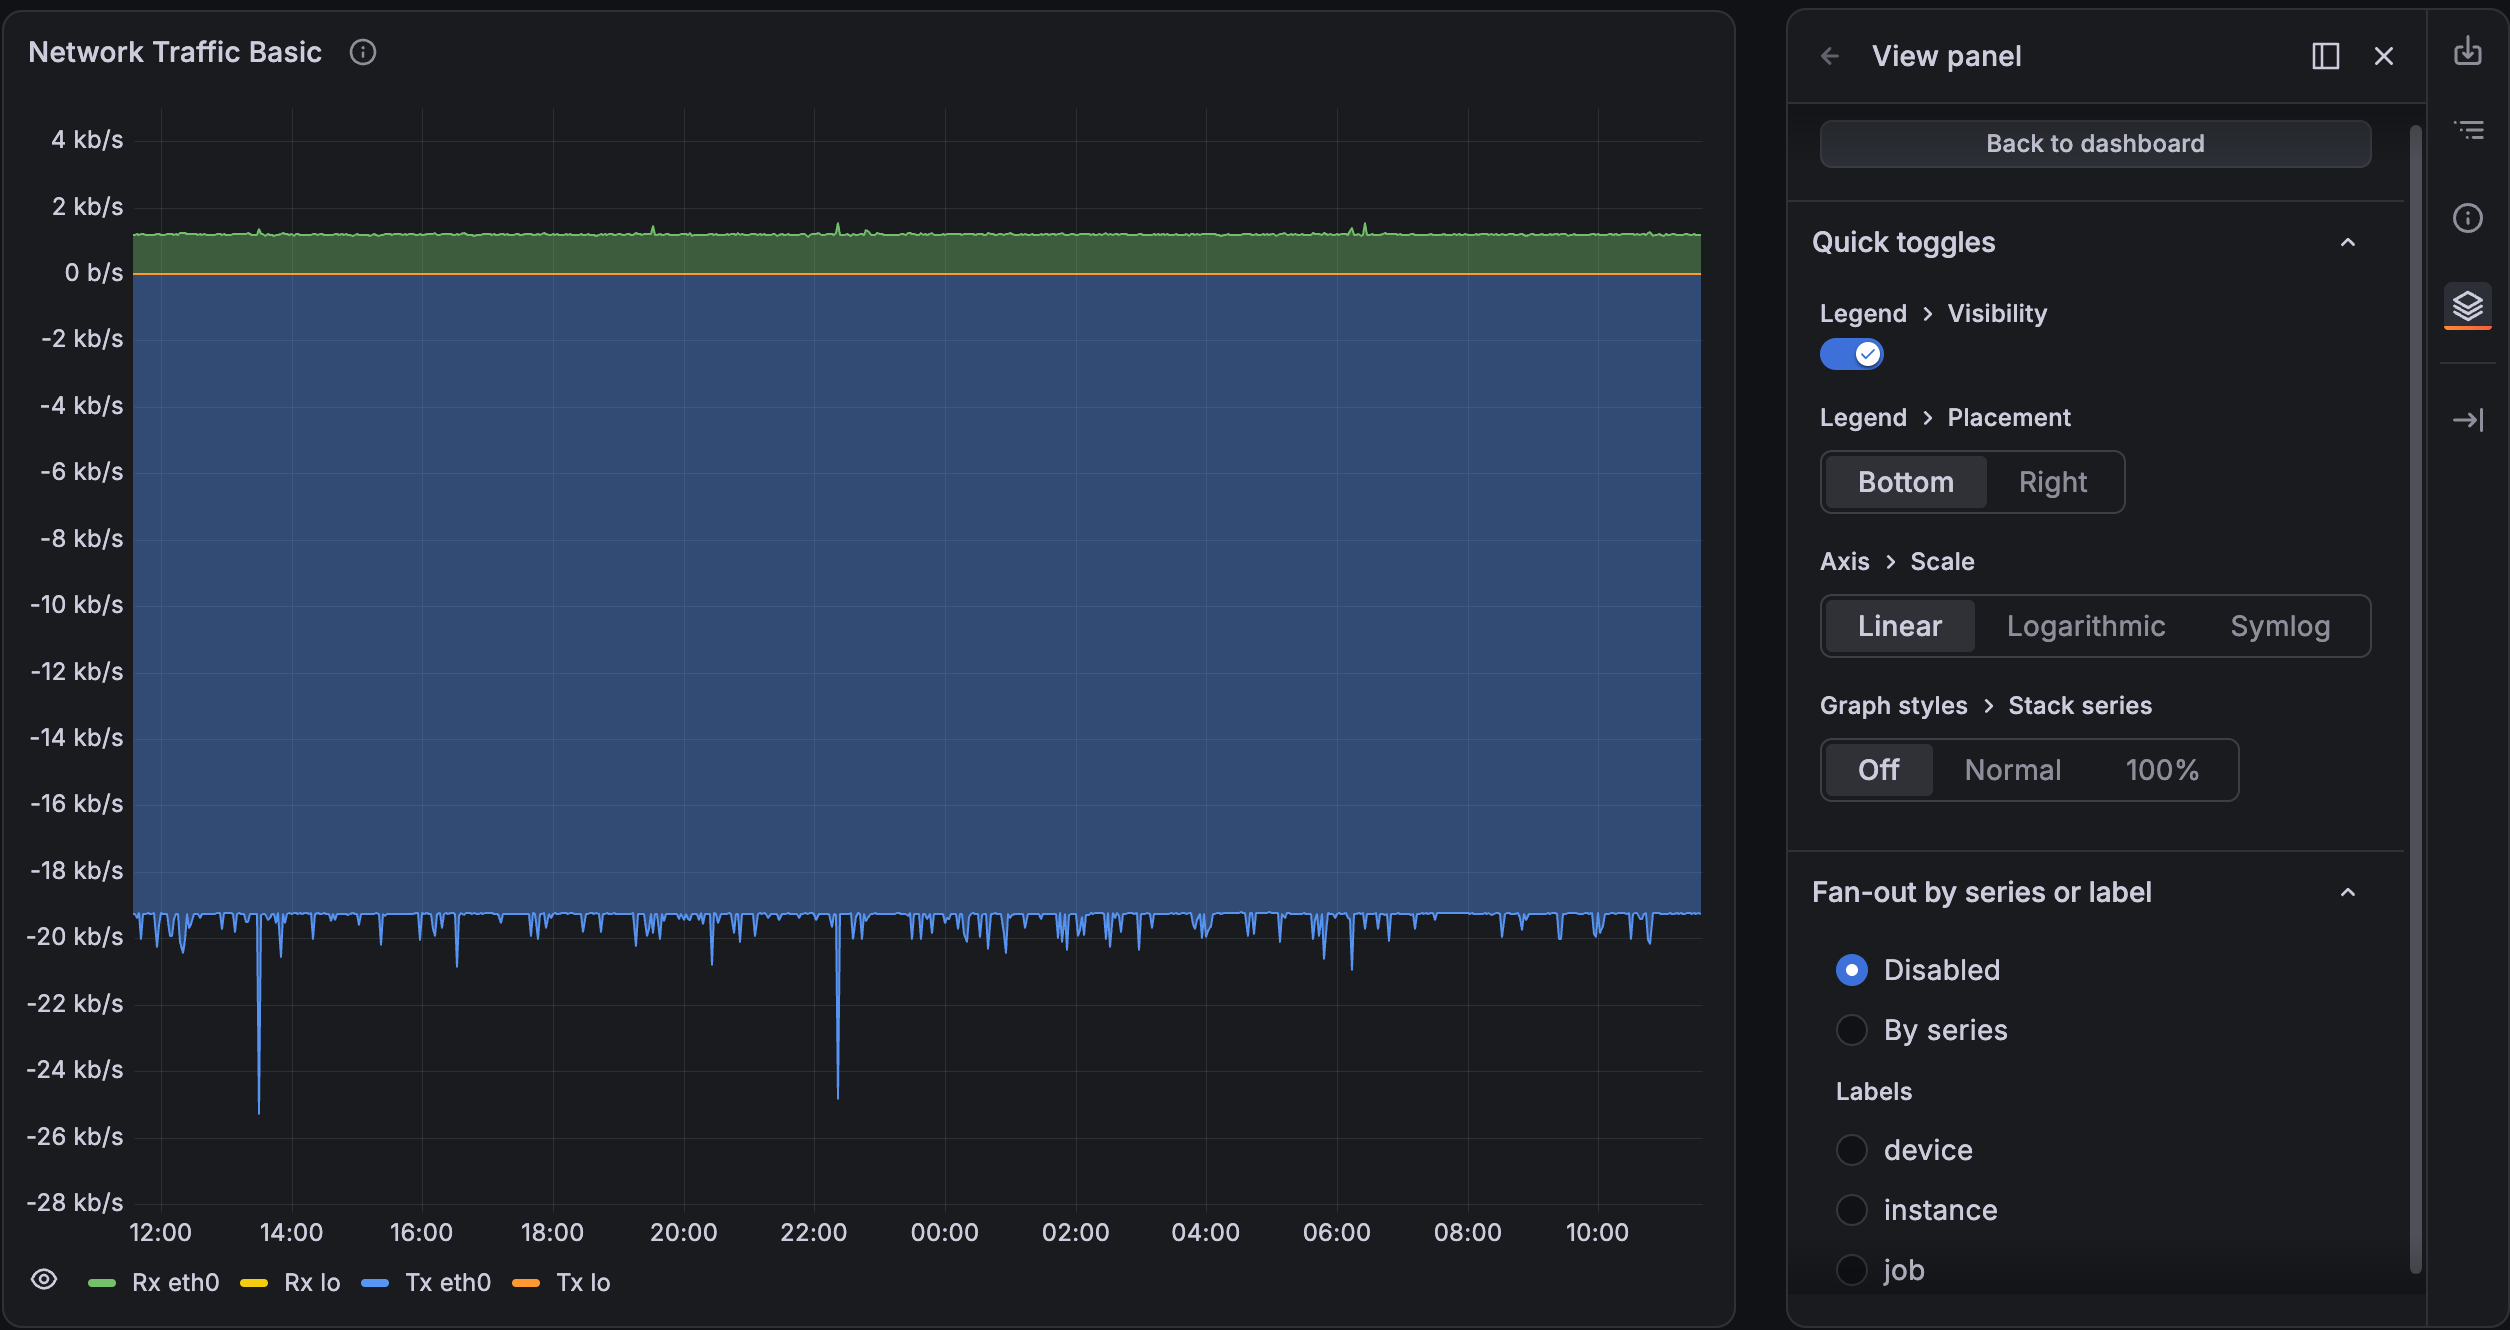
When you open a panel in full-screen view mode, Grafana displays a View panel sidebar with controls for adjusting the panel. These controls make it easier to view specific data or identify patterns and correlations. Because these controls exist in view mode, you don’t need edit permissions to use them, and the changes you make don’t affect the saved dashboard.
The sidebar includes the following controls:
- Quick toggles: Adjust common visualization options, such as legend visibility and basic graph styles.
- Fan-out by series or label: Split one graph into multiple graphs per series or label value. This is useful when a single graph has many series and you need to spot which series or labels share an anomaly.
Note
This feature is supported for time series visualizations. If it’s added to more visualizations, available quick toggles and fan-out support will depend on the visualization type.
Fan-out by series or label
Fan-out splits one panel into multiple panels so you can compare series or label values side by side. This is useful when a single graph has many series and you need to spot which series or labels share an anomaly.
In the Fan-out by series or label section, choose one of the following:
If the panel data has no labels, Grafana shows Data has no labels under Labels.
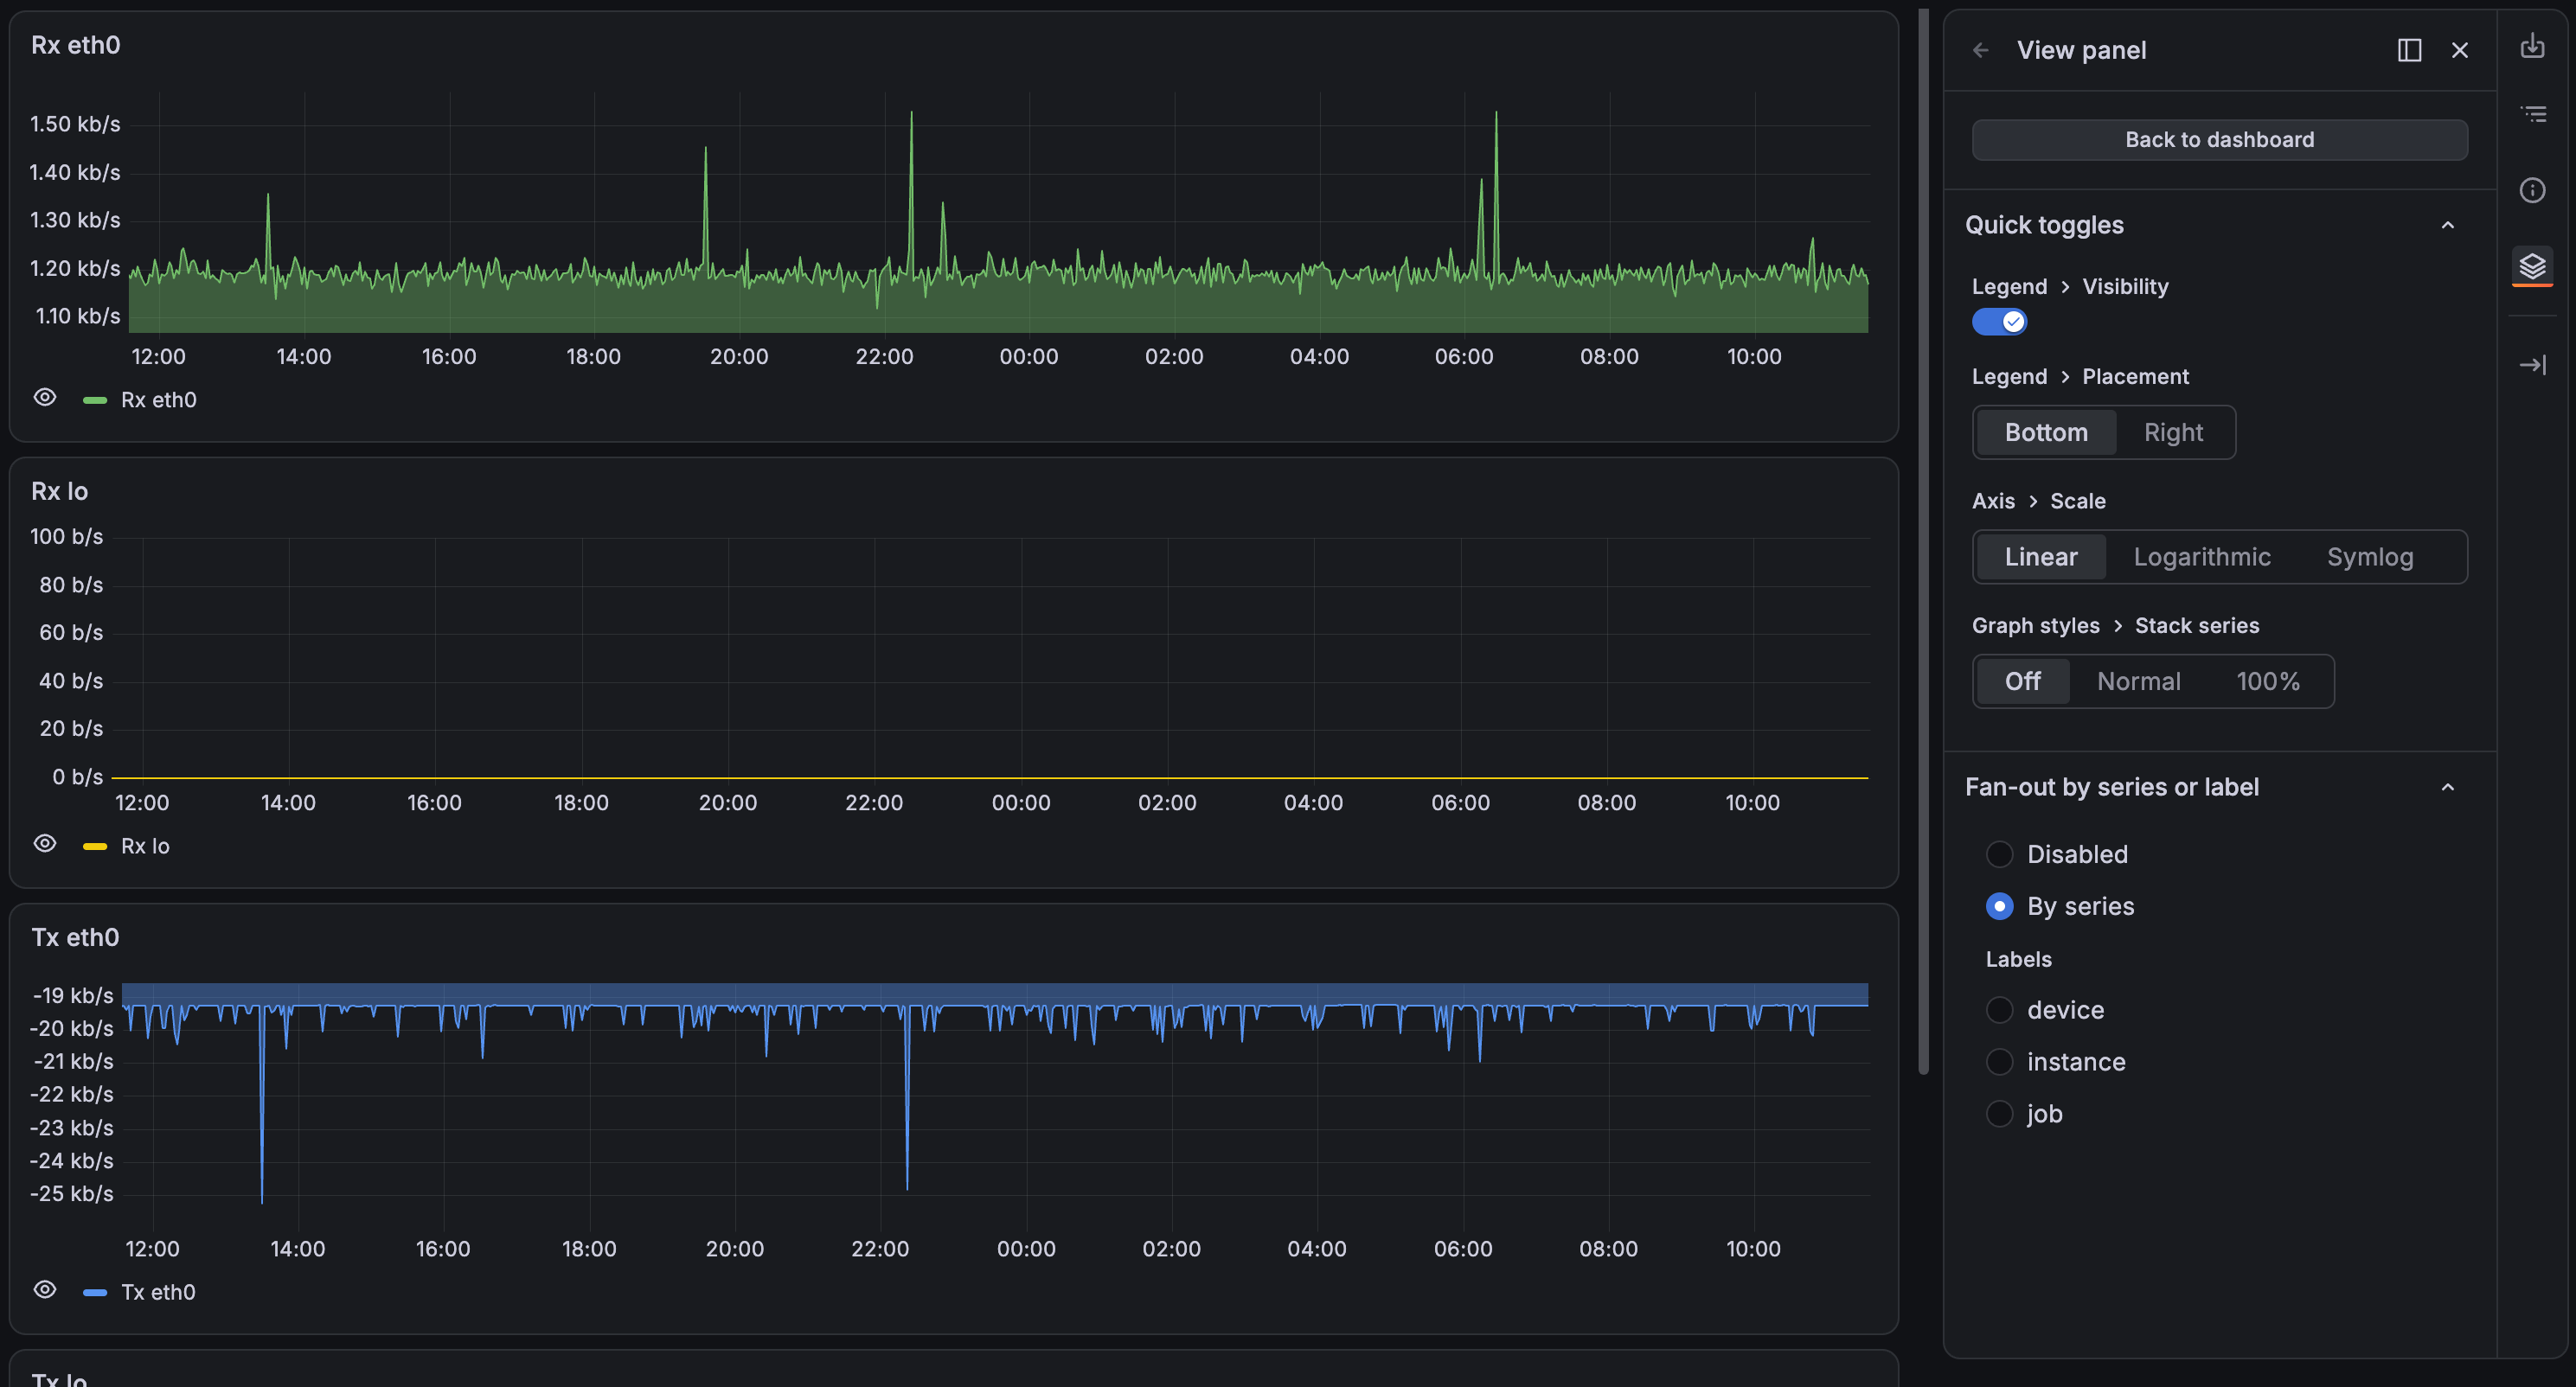
When you select a fan-out mode, Grafana updates the dashboard URL with a fanout query parameter so you can share the split view.
Leaving view mode removes that parameter.
Keyboard shortcuts
Grafana has a number of keyboard shortcuts available specifically for panels. Press ? on your keyboard to display all keyboard shortcuts available in your version of Grafana.
By hovering over a panel with the mouse you can use some shortcuts that target that panel.
e: Toggle panel edit viewv: Toggle panel full screen viewpu: Copy panel share linkpe: Share embedps: Share snapshotpx: Open panel in Explorepc: Copy panelpv: Paste panelpd: Duplicate Paneli: Inspectpl: Hide or show legendpr: Remove Panel
Panel time settings
You can configure the following settings to control the time range for a panel:
Pan and zoom panel time range
You can pan the panel time range left and right, and zoom it and in and out. This, in turn, changes the dashboard time range.
This feature is supported for the following visualizations:
- Candlestick
- Heatmap
- State timeline
- Status history
- Time series
Zoom in
Click and drag on the panel to zoom in on a particular time range.
The following screen recordings show this interaction in the time series and candlestick visualizations:
Time series
Candlestick
Zoom out
Double-click anywhere on the panel to zoom out the time range.
The range doubles with each double-click, adding equal time to each side of the range. For example, if the original time range is from 9:00 to 9:59, the time range changes as follows with each double-click:
- Next range: 8:30 - 10:29
- Next range: 7:30 - 11:29
The following screen recordings demonstrate the preceding example in the time series and heatmap visualizations:
Time series
Heatmap
Pan
Click and drag the x-axis area of the panel to pan the time range.
The time range shifts by the distance you drag. For example, if the original time range is from 9:00 to 9:59 and you drag 30 minutes to the right, the time range changes to 9:30 to 10:29.
The following screen recordings show this interaction in the time series visualization:
Time series
Add a panel
To add a panel to an empty dashboard, click or drag the panel onto the dashboard:
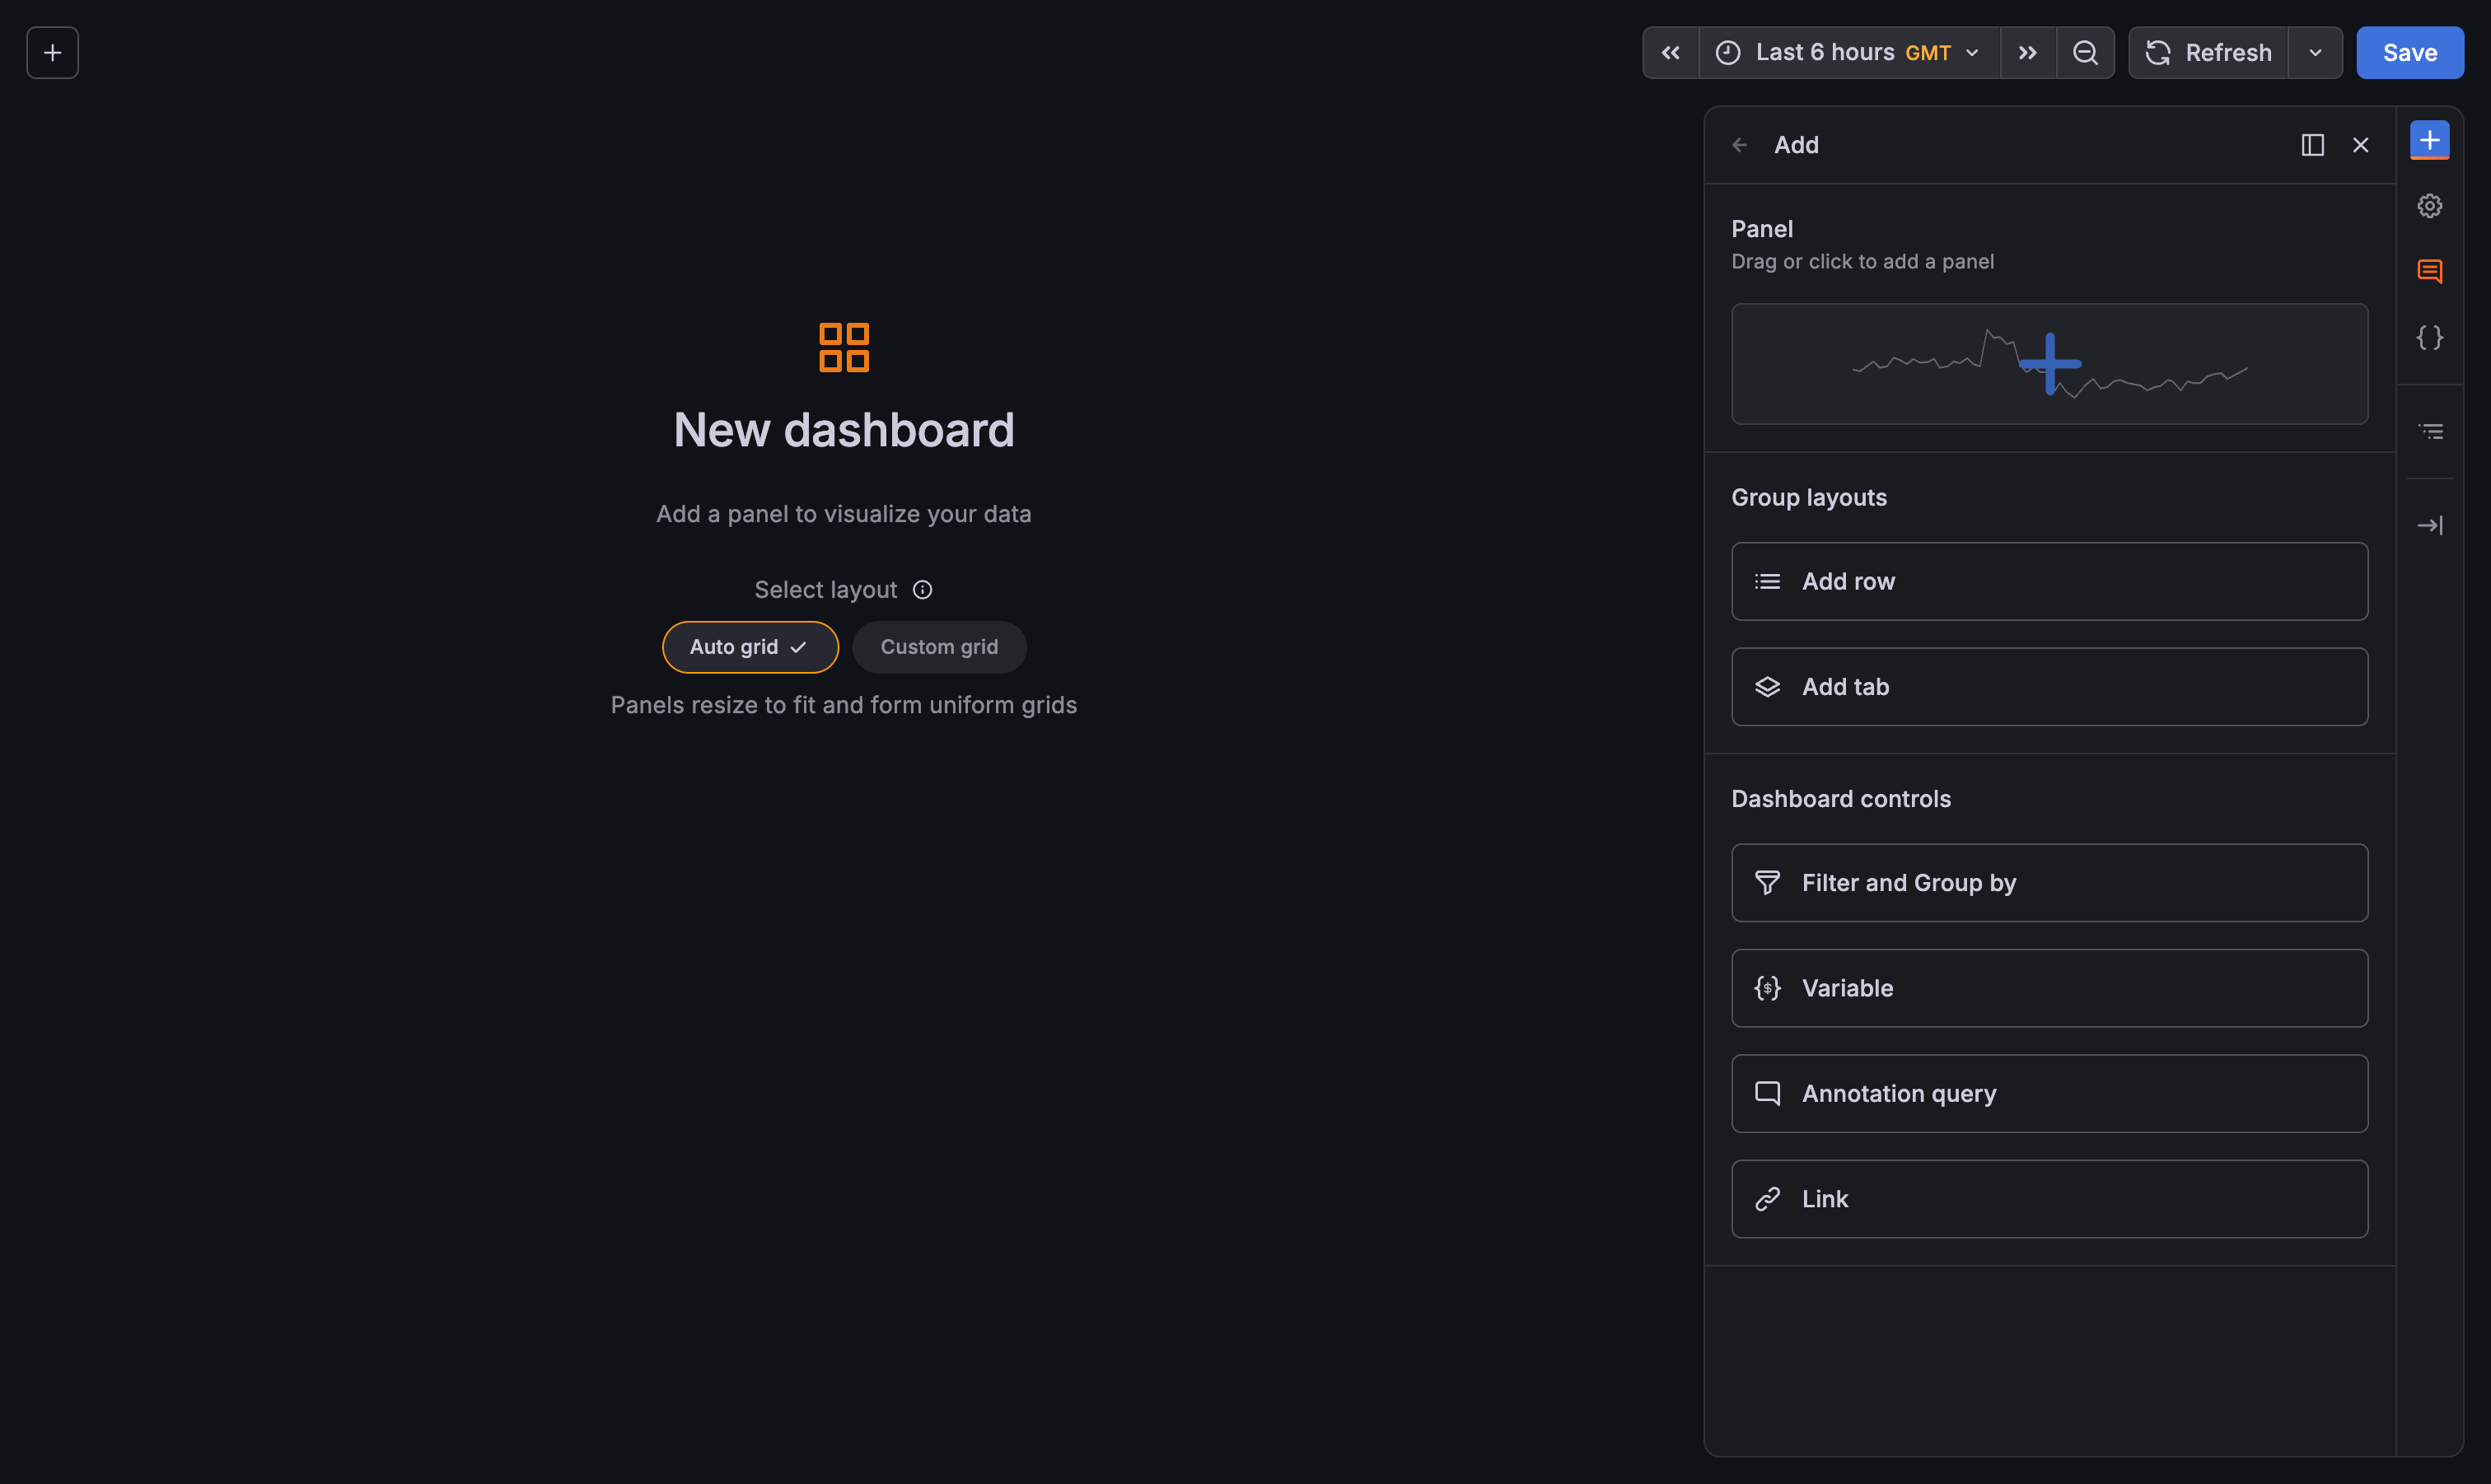
To add a panel to an existing dashboard, follow these steps:
Click Edit in the top-right corner of the dashboard.
Click the Add new element icon (blue plus sign).
![Add element icon]()
Click or drag a panel onto the dashboard.
Panel configuration
To configure panels, refer to the following subtopics:
Was this page helpful?
Related resources from Grafana Labs



