
This is documentation for the next version of Grafana. For the latest stable release, go to the latest version.
Gauge
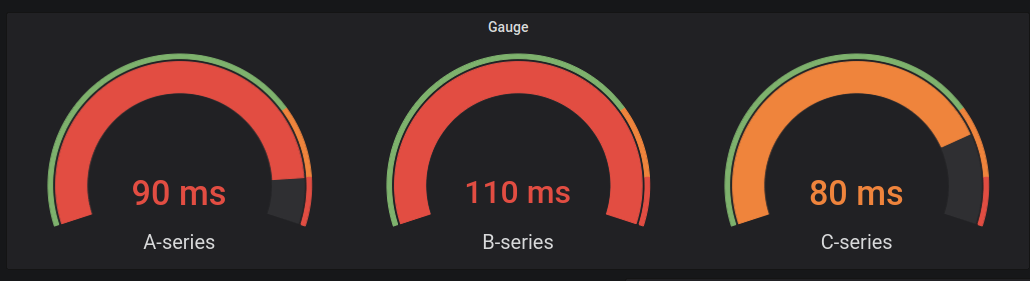
Gauges are single-value visualizations that can repeat a gauge for every series, column or row.
Give it a try using Grafana Play
With Grafana Play, you can explore and see how it works, learning from practical examples to accelerate your development. This feature can be seen on Grafana Gauge Visualization.
Value options
Use the following options to refine how your visualization displays the value:
Show
Choose how Grafana displays your data.
Calculate
Show a calculated value based on all rows.
- Calculation - Select a reducer function that Grafana will use to reduce many fields to a single value. For a list of available calculations, refer to Calculation types.
- Fields - Select the fields display in the panel.
All values
Show a separate stat for every row. If you select this option, then you can also limit the number of rows to display.
- Limit - The maximum number of rows to display. Default is 5,000.
- Fields - Select the fields display in the panel.
Gauge
Adjust how the gauge is displayed.
Orientation
Choose a stacking direction.
- Auto - Gauges display in rows and columns.
- Horizontal - Gauges display top to bottom.
- Vertical - Gauges display left to right.
Show threshold labels
Controls if threshold values are shown.
Show threshold markers
Controls if a threshold band is shown outside the inner gauge value band.
Gauge size
Choose a gauge size mode.
- Auto - Grafana determines the best gauge size.
- Manual - Manually configure the gauge size.
Min width
Set the minimum width of vertically-oriented gauges.
If you set a minimum width, the x-axis scrollbar is automatically displayed when there’s a large amount of data.
Note
This option only applies when gauge size is set to manual.
Min height
Set the minimum height of horizontally-oriented gauges.
If you set a minimum height, the y-axis scrollbar is automatically displayed when there’s a large amount of data.
Note
This option only applies when gauge size is set to manual.
Neutral
Set the starting value from which every gauge will be filled.
Text size
Adjust the sizes of the gauge text.
- Title - Enter a numeric value for the gauge title size.
- Value - Enter a numeric value for the gauge value size.
Was this page helpful?
Related resources from Grafana Labs


