
This is documentation for the next version of Grafana documentation. For the latest stable release, go to the latest version.

Query editor in Explore
The query editor is the interface where you construct the query for a data source. Each data source’s query editor provides a customized user interface that helps you write queries that take advantage of its unique capabilities.
Because of the differences between query languages, each data source query editor looks and functions differently. Depending on your data source, the query editor might provide auto-completion features, metric names, variable suggestions, or a visual query-building interface.
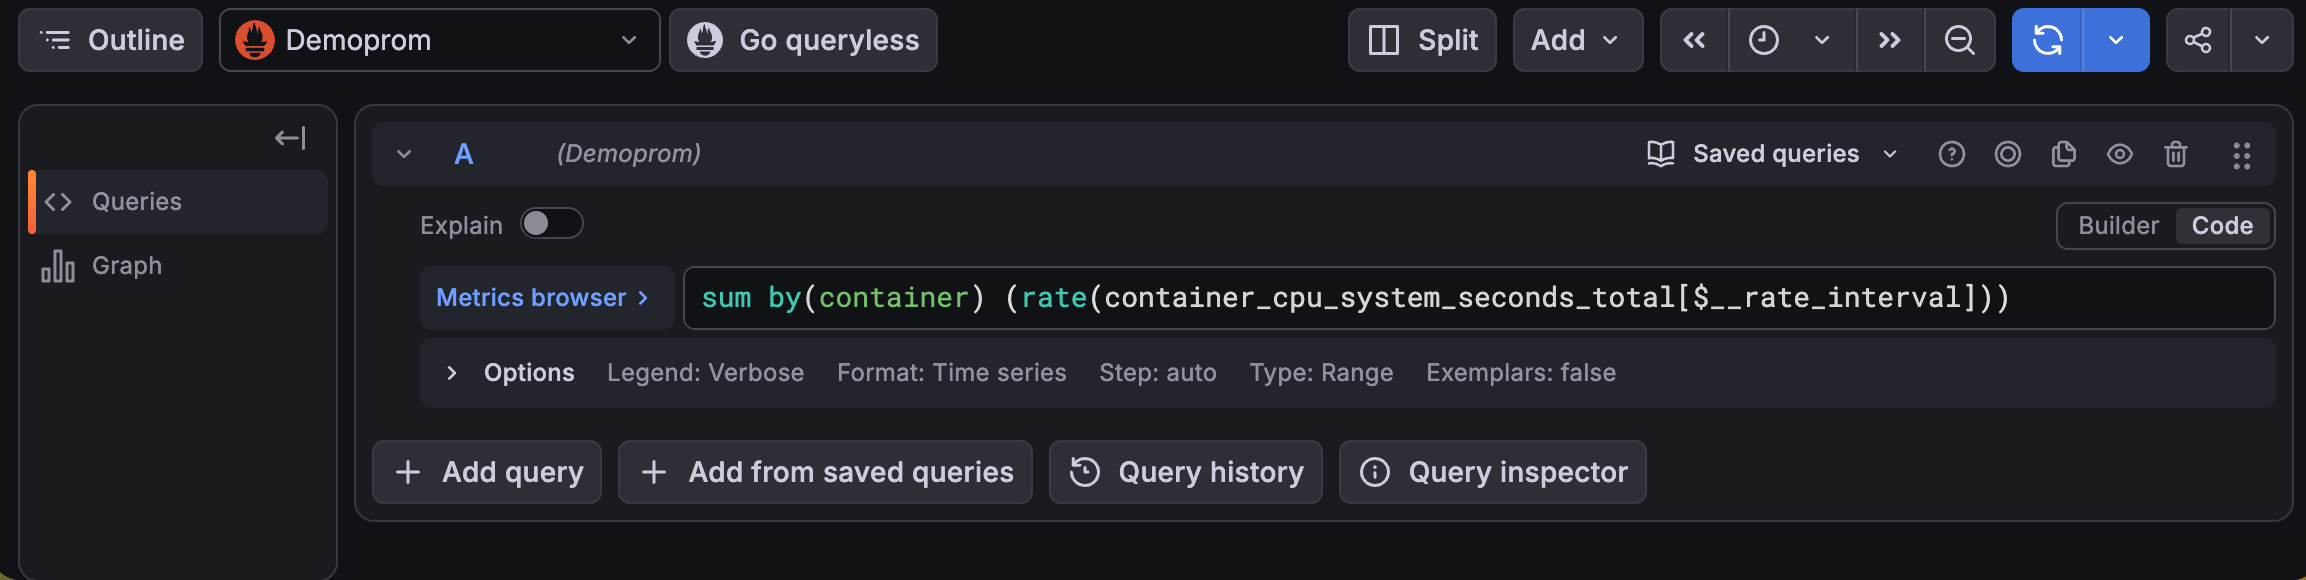
For details on a specific data source’s unique query editor features, refer to its documentation:
- For data sources included with Grafana, refer to Built-in core data sources, which links to each core data source’s documentation.
- For data sources installed as plugins, refer to the documentation for the plugin.
- Data source plugins in the Grafana plugin catalog link to or include their documentation in their catalog listings. For details about the plugin catalog, refer to Plugin management.
- For links to Grafana Enterprise data source plugin documentation, refer to the Enterprise plugins index.
Query syntax
Each data source uses a different query languages to request data. For details on a specific data source’s unique query language, refer to its documentation.
PostgreSQL example:
SELECT hostname FROM host WHERE region IN($region)PromQL example:
query_result(max_over_time(<metric>[${__range_s}s]) != <state>)Special data sources
Grafana also includes three special data sources: Grafana, Mixed, and Dashboard. For details, refer to Data sources
Saved queries
Note
Saved queries is only available on Grafana Enterprise and Grafana Cloud.
You can save queries that you’ve created so they can be reused by you and others in your organization. This helps users across your organization find insights in Explore without having to create their own queries or know a query language. It also helps you avoid having several users build the same queries for the same data sources multiple times.
Saved queries are supported in:
Learn more about saved queries:
- Saved queries dialog box
- Roles, permissions, and RBAC
- How to save a query
- Variables in saved queries
- Manage saved queries as code
- Known limitations
Saved queries dialog box
The Saved queries dialog box gives you access to all the saved queries in your organization:
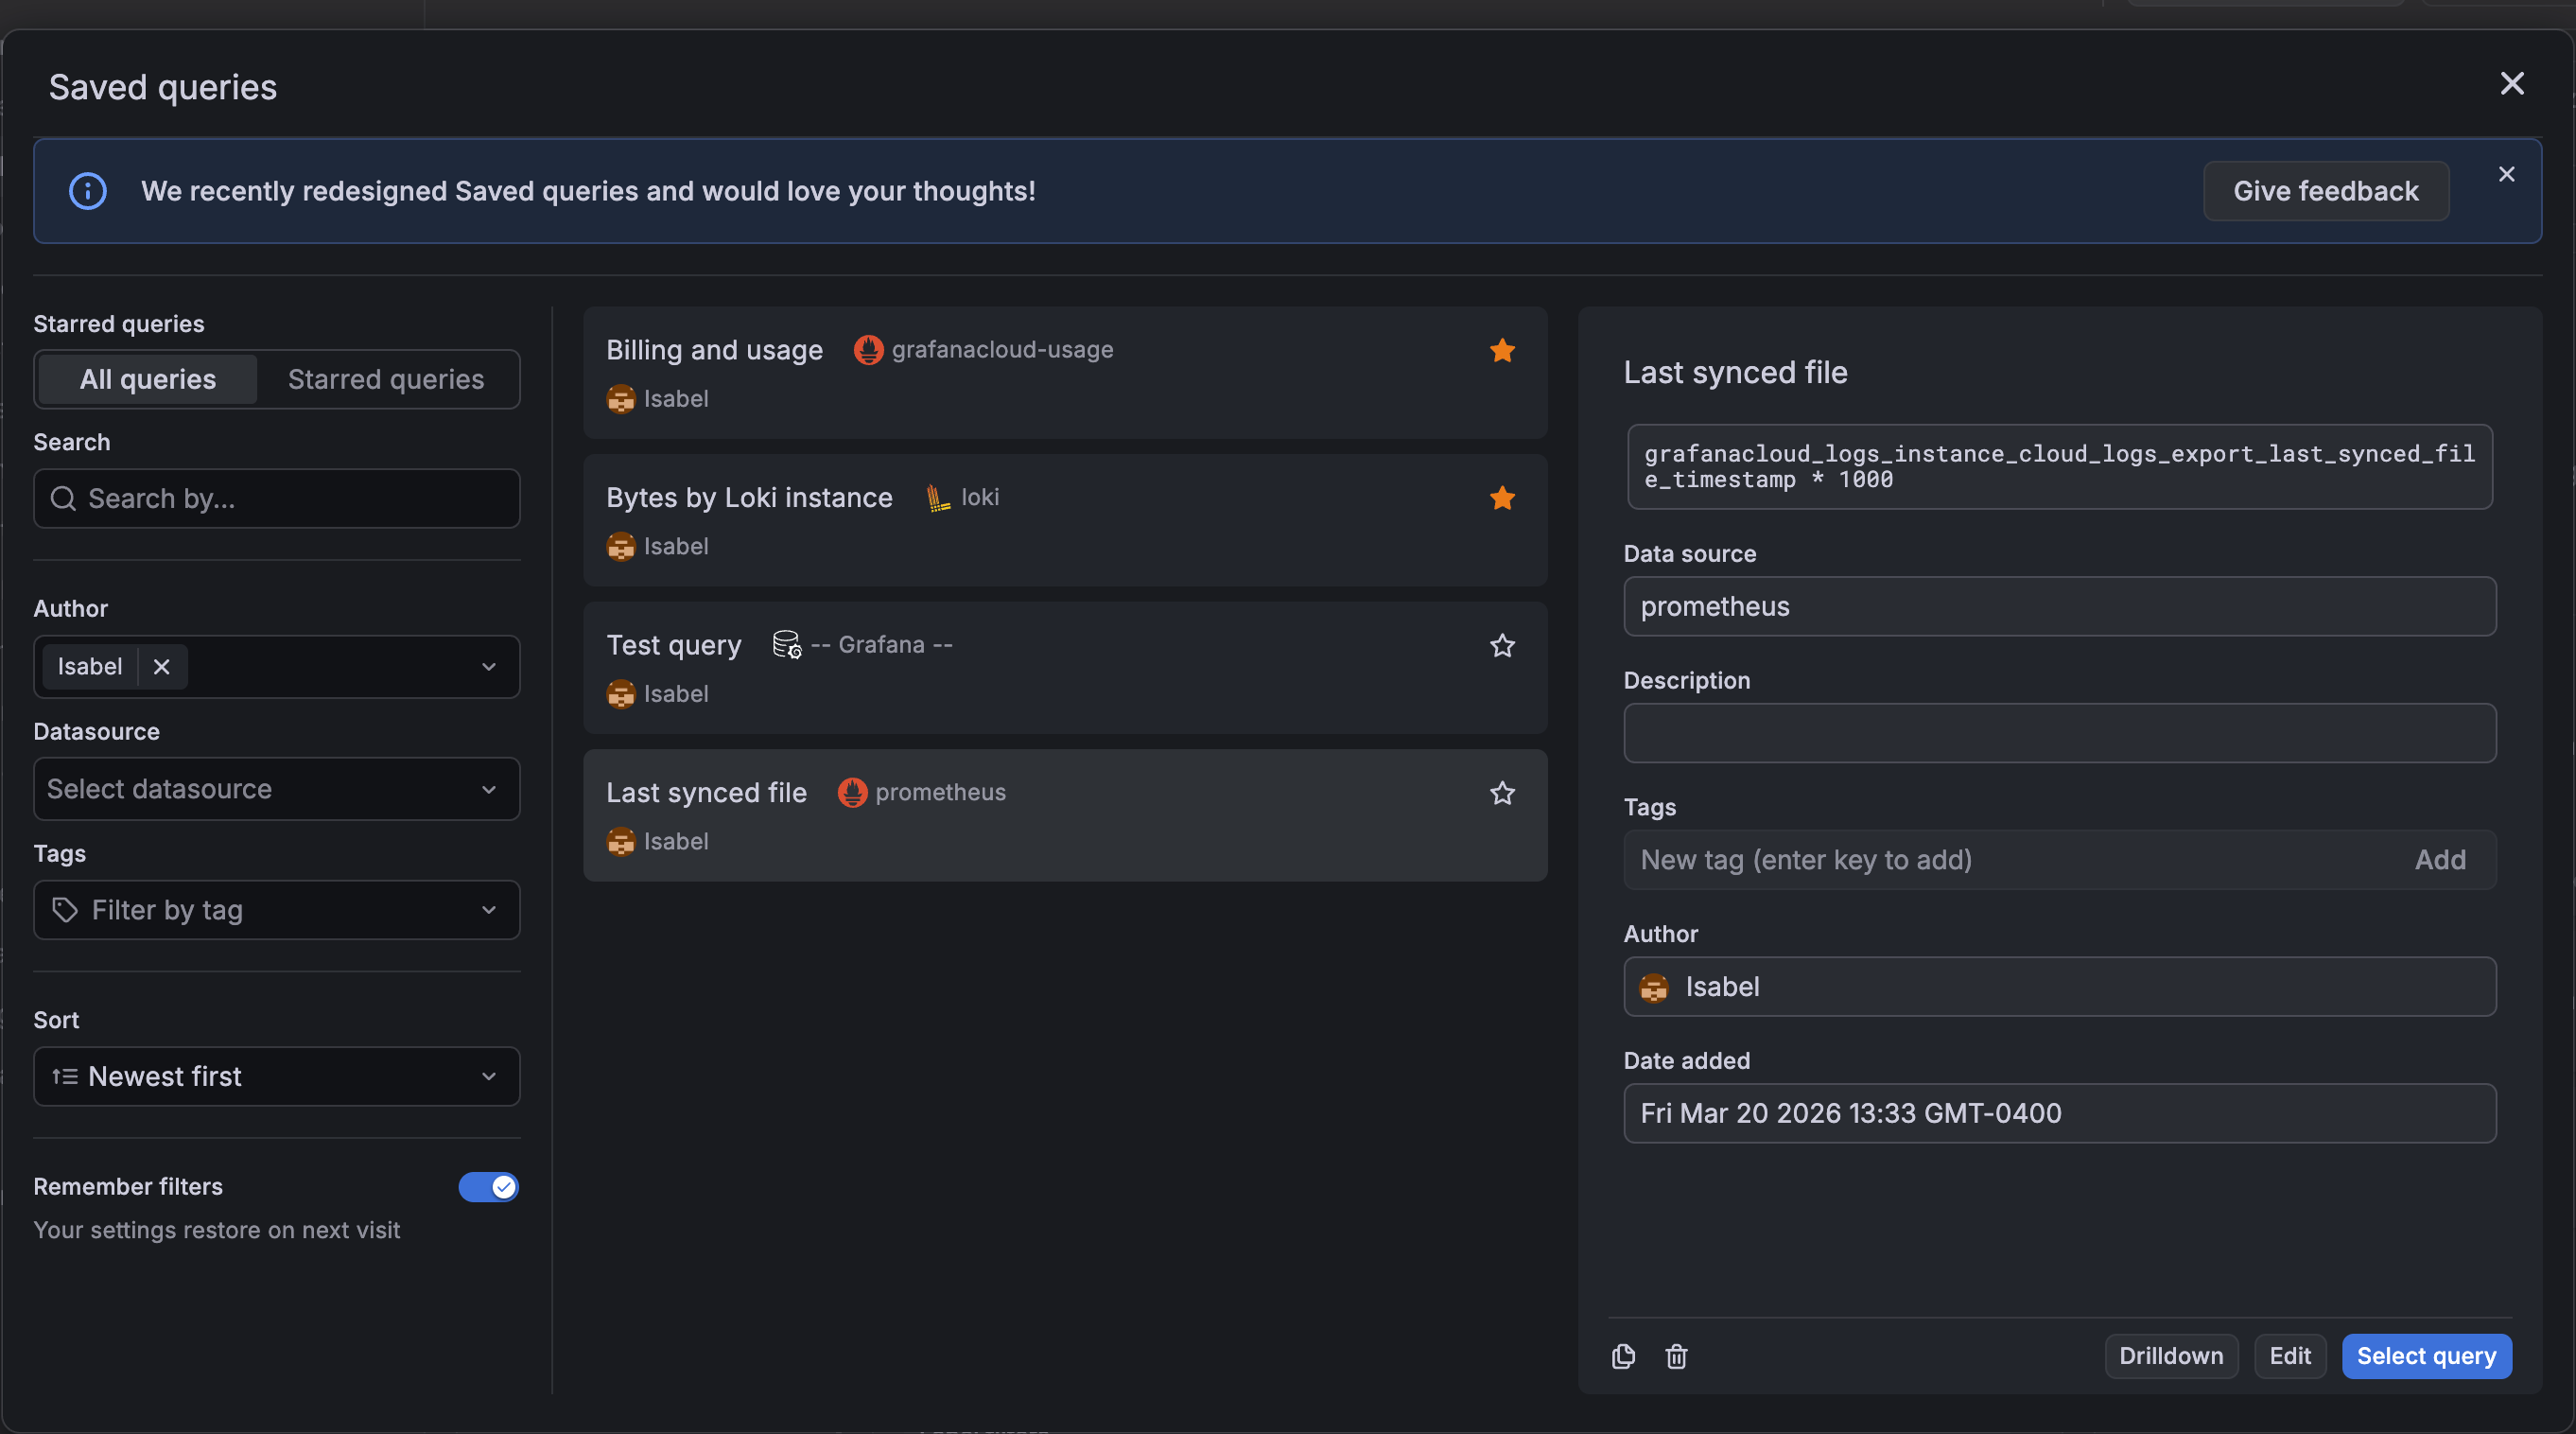
You can access saved queries three ways:
- Press
Ctrl + KorCmd + Kto open the command palette and search “Saved queries”, and select the Open saved queries action. The Shared queries dialog box opens, where you can select a query and then click Open in Explore. - Click Saved queries > Replace query in the query editor.
- At the bottom of the query editor, click Add from saved queries.
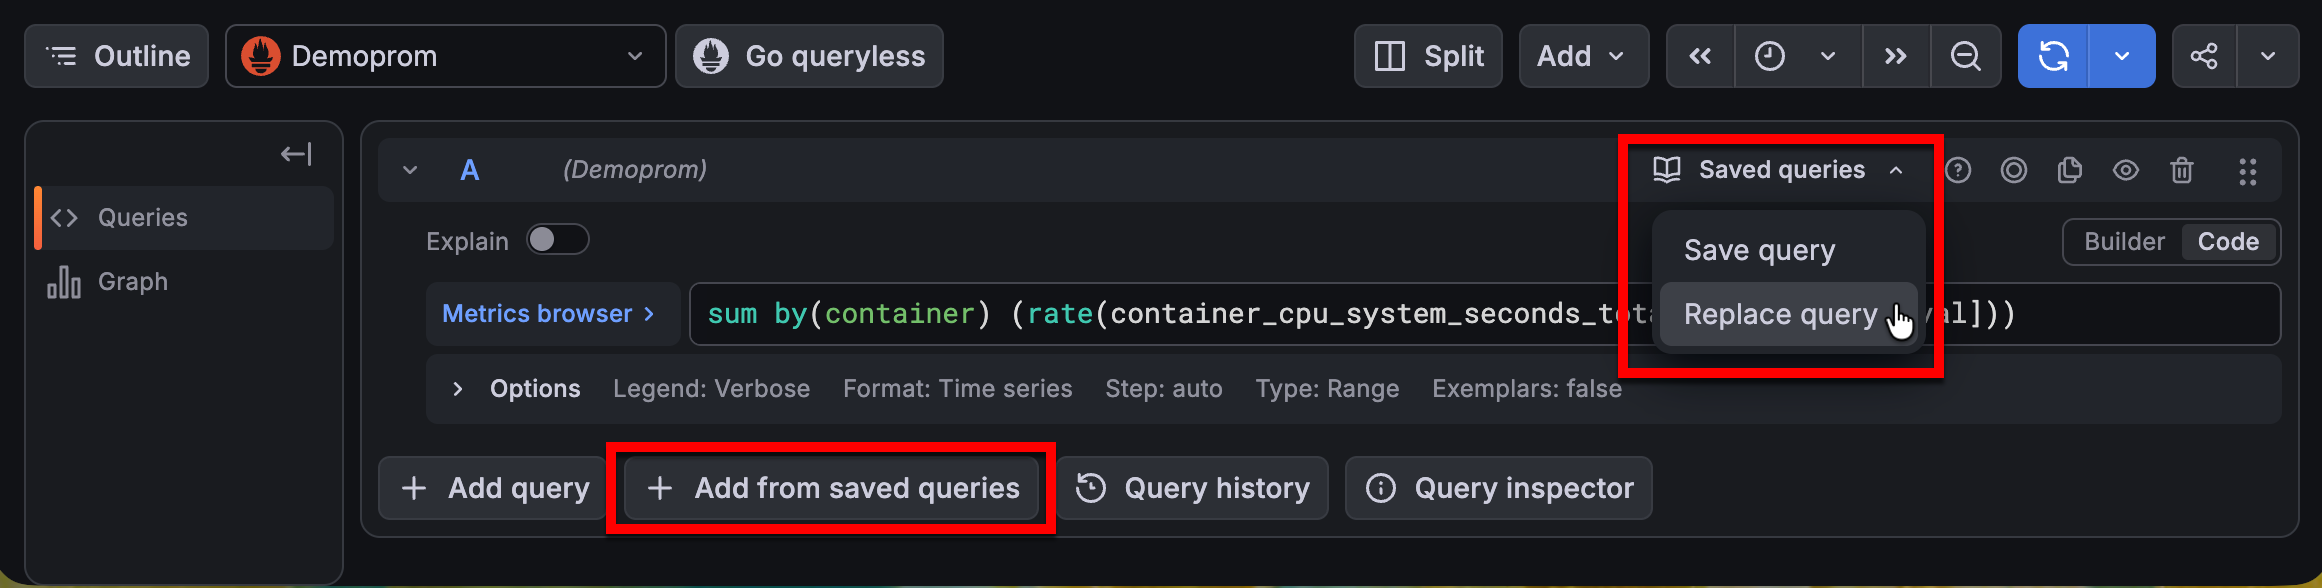
Clicking Add from saved queries adds an additional query, while clicking Replace query updates your configured query.
From the Saved queries dialog box, you can:
- Search for queries by data source name, query content, title, or description.
- Sort queries alphabetically or by creation date.
- Filter by data source name, author name, and tags. The tag filter uses the
ORoperator, while the others use theANDoperator. Use the Remember filters switch to persist your filter selections across sessions in your local storage. - Star queries so that they appear in the Starred queries filter view.
- Duplicate or delete a saved query.
- Edit a query title, description, or tags.
- Click Edit at the bottom of the dialog box to update the body of a query.
You can apply all the same search, filter, and sort options in the Starred queries filter view.
Tip
When you select a query with a Loki, Mimir, Tempo, or Pyroscope data source, the Saved queries dialog box displays a Drilldown button. Click the button to open the associated Drilldown app, while maintaining the context of the query. Learn more about these apps in the Drilldown documentation.
Roles, permissions, and RBAC
Saved queries support role-based access controls. By default, saved queries have two RBAC roles:
- Writer: Create, update, and delete all saved queries.
- Reader: Reuse saved queries.
If you used saved queries prior to the addition of RBAC support in Grafana v12.4, Grafana user roles are mapped as follows:
- Admin > Writer
- Editor > Writer
- Viewer > Reader
Save a query
To save a query you’ve created:
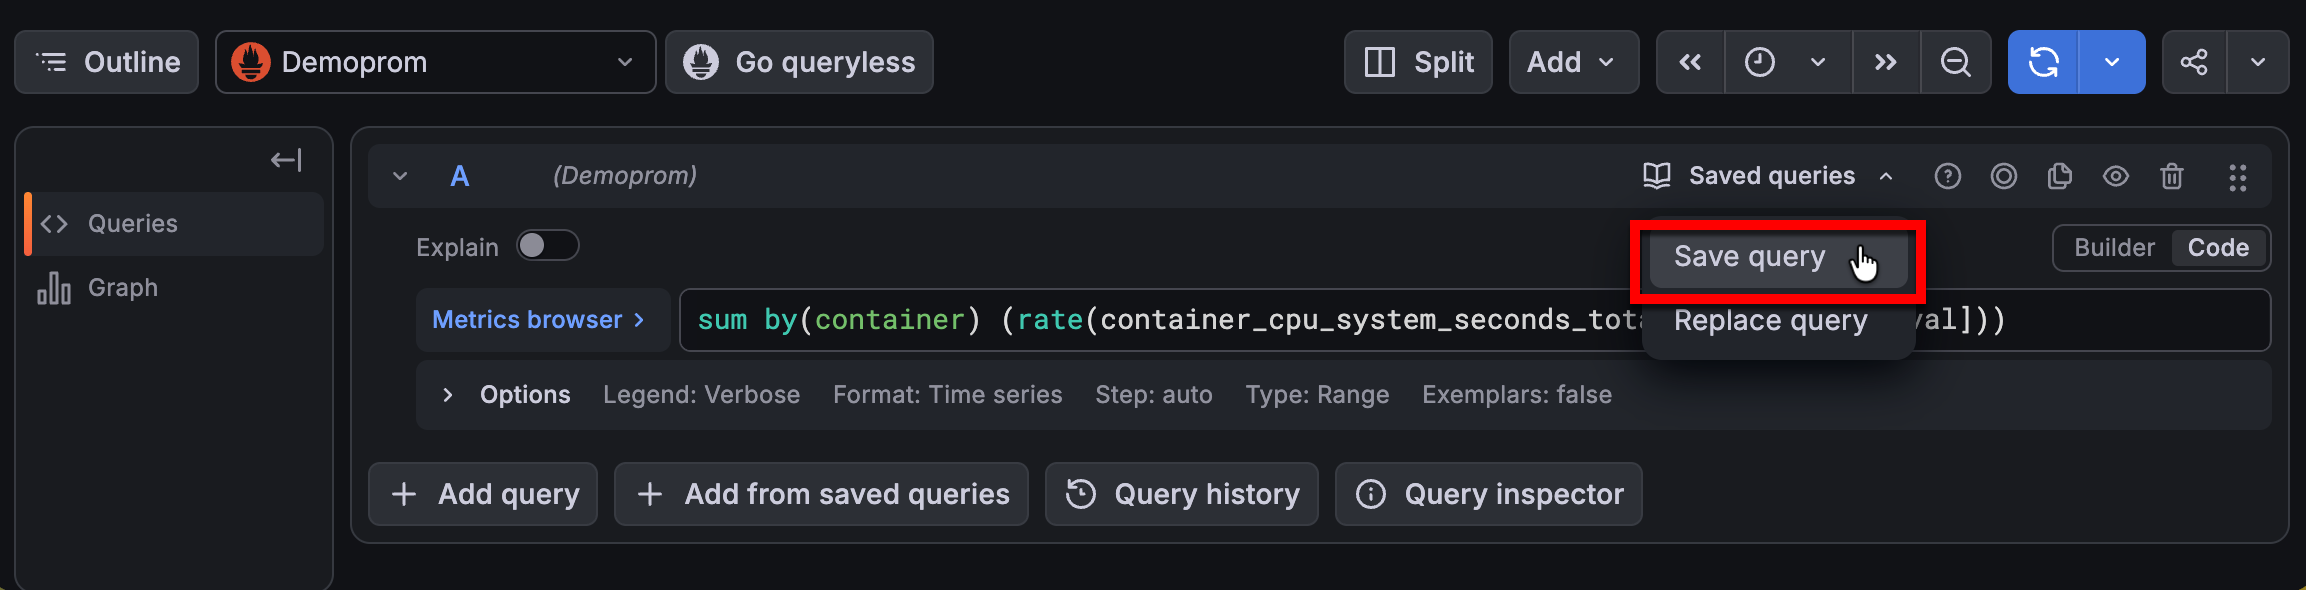
From the query editor, open the Saved queries drop-down menu and click the Save query option:
![Save a query]()
In the Saved queries dialog box, enter a title for the query that makes it easier to find later.
(Optional) Enter a description and relevant tags.
Click Save.
Variables in saved queries
If a saved query includes variables, you can substitute the variables in the query without modifying it by mapping them to a custom value. This is useful in environments where variable names or available values differ between dashboards.
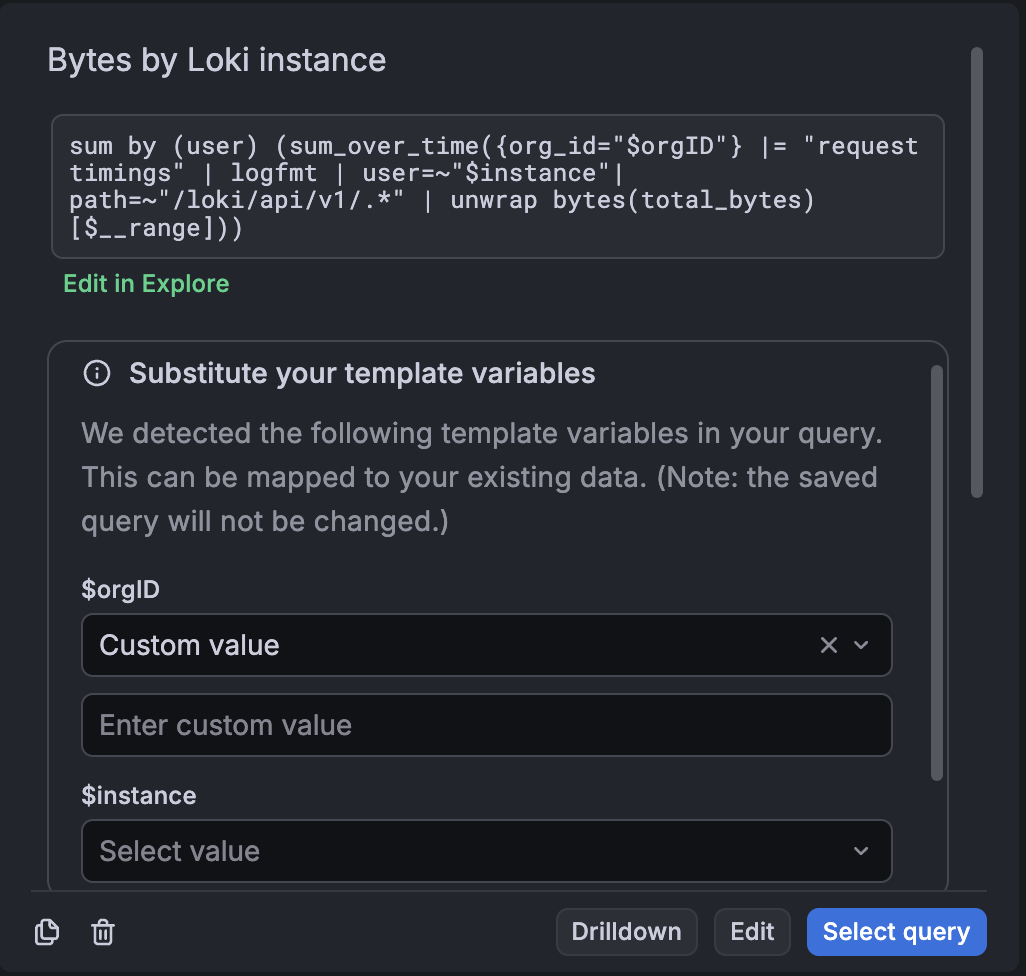
Grafana applies your selections to the query before inserting it into the dashboard. However, the substitutions only apply to the query when it’s reused, and the original saved query remains unchanged.
Manage saved queries as code
You can manage saved queries as code with the Grafana Terraform provider, which lets you version-control your query library and keep it consistent across instances. For more information, refer to Manage saved queries using Terraform.
Known limitations
- No validation is performed when you save a query, so it’s possible to save an invalid query. You should confirm the query is working properly before you save it.
- You can save a maximum of 1000 queries.
- If you have multiple queries open in Explore and you edit one of them by way of the Edit in Explore function in the Saved queries dialog box, the edited query replaces your open queries in Explore.
Add a query
To add a query, follow these steps:
If you want use a data source that’s not the default one, click the data source drop-down menu in the toolbar and make a selection.
If you want to use multiple data sources, select the Mixed data source at this step. The query editor displays a secondary data source picker.
To create a query, do one of the following:
- Write or construct a query in the query language of your data source.
- Click Replace to reuse a saved query.
Note
Saved queries is only available on Grafana Enterprise and Grafana Cloud.
(Optional) To save the query for reuse, click the Save in the editor pane.
(Optional) At the bottom of the query editor, click Add query or Add from saved queries to add more queries as needed.
Click the Run query icon in the toolbar.
Grafana queries the data source. If the data source supports graph and table data, Explore displays the results in the Graph.
Manage queries
The following table describes actions you can take for each query:
| Icon | Description |
|---|---|
 | Saved query options. Open the drop-down list and choose from Save query or Replace query.(Enterprise and Cloud only). |
 | Toggles query editor help. If supported by the data source, click this icon to display information on how to use the query editor or provide quick access to common queries. Click the More query actions menu to access this option. |
 | Create recorded queries so you can see trends over time by taking a snapshot of a data point on a set interval (Enterprise and Cloud only). |
 | Copies a query. Duplicating queries is useful when working with multiple complex queries that are similar and you want to either experiment with different variants or do minor alterations. Click the More query actions menu to access this option. |
 | Hides a query. Grafana does not send hidden queries to the data source. |
 | Removes a query. Removing a query permanently deletes it, but sometimes you can recover deleted queries by reverting to previously saved versions of the panel. |
Was this page helpful?
Related resources from Grafana Labs



