This is documentation for the next version of Grafana documentation. For the latest stable release, go to the latest version.
Advanced variable configurations
The advanced variable configurations described on this page help you build dashboards that adapt to complex data structures and user selections:
- Multi-property variables: Map one logical value to multiple source-specific values.
- Chained variables: Update the options in one variable based on the selections in another.
- Regular expression filtering: Filter the values returned by a variable query.
These configurations are useful for dashboards that span multiple environments, data sources, regions, clusters, namespaces, or other hierarchical data.
Multi-property variables
If a multi-source dashboard uses multiple values for the same logical concept, such as an environment identified as dev in one source and development in another, use a multi-property variable to reference those values from one variable. This lets you map related identifiers together and reference the property you need in panels and queries.
To do so, configure a JSON array in which each object can have any number of properties. Then, you can reference any of the properties as you use those variables.
This applies to the following variable types:
- Custom
- Query
- Infinity
- PostgreSQL
Multi-property custom variables
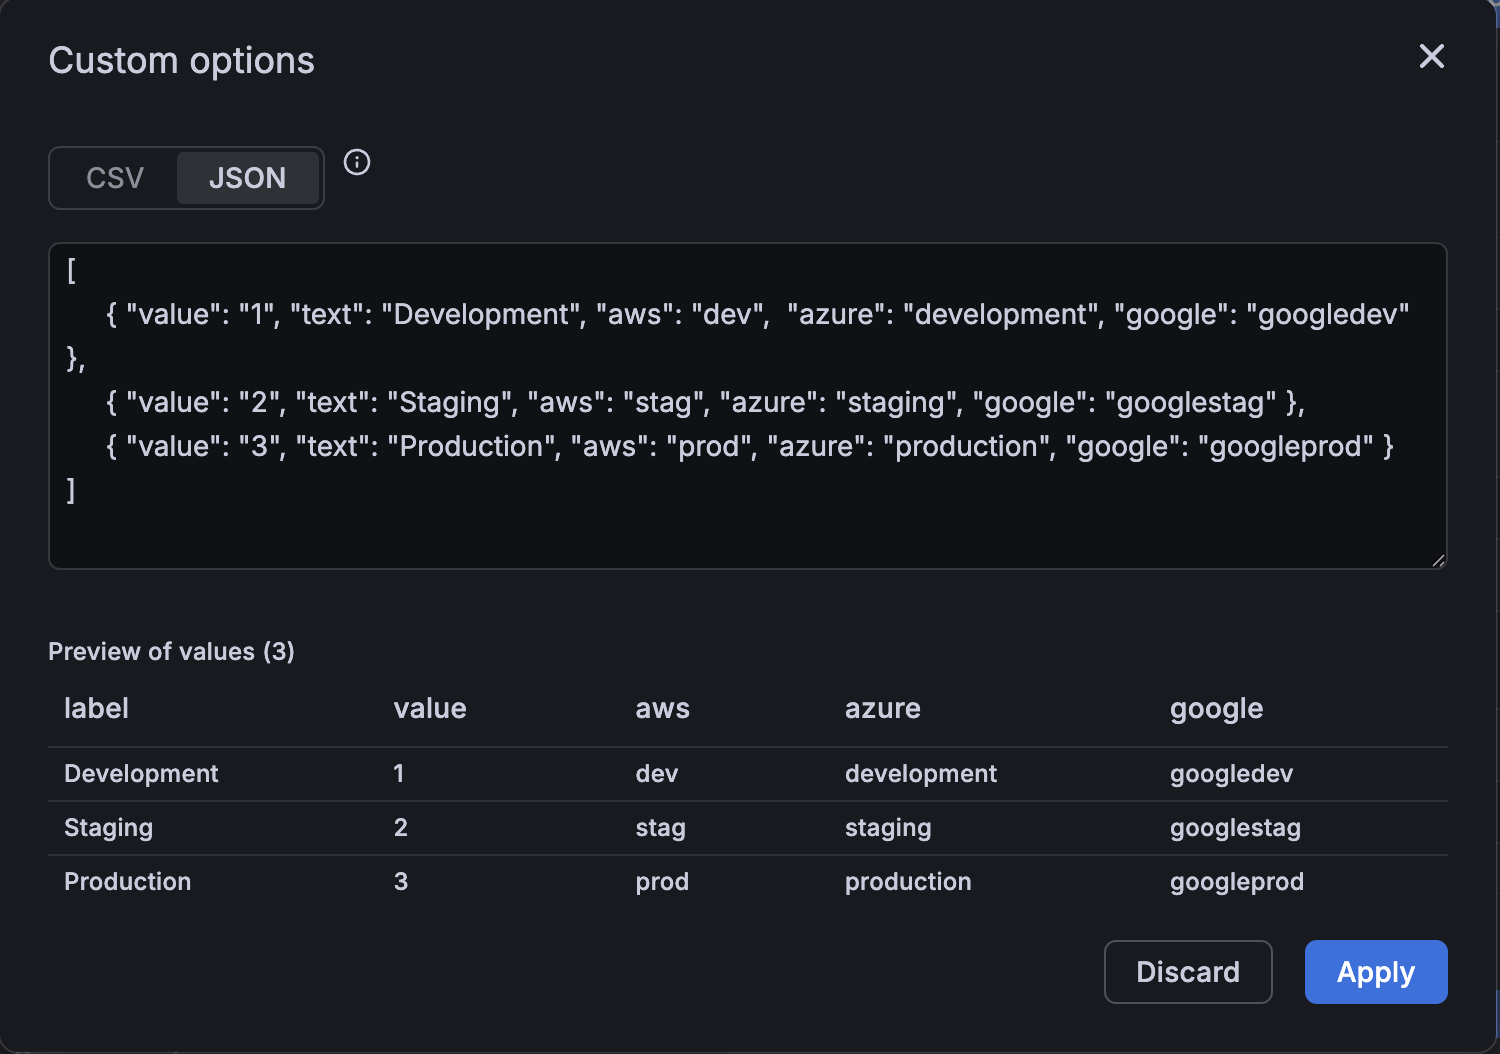
To create a custom variable with multiple properties, define a JSON array, like this:
[
  { "value": "1", "text": "Development", "aws": "dev", "azure": "development", "google": "googledev" },
  { "value": "2", "text": "Staging", "aws": "stag", "azure": "staging", "google": "googlestag" },
  { "value": "3", "text": "Production", "aws": "prod", "azure": "production", "google": "googleprod" }
]
This is how those values are displayed in a preview:
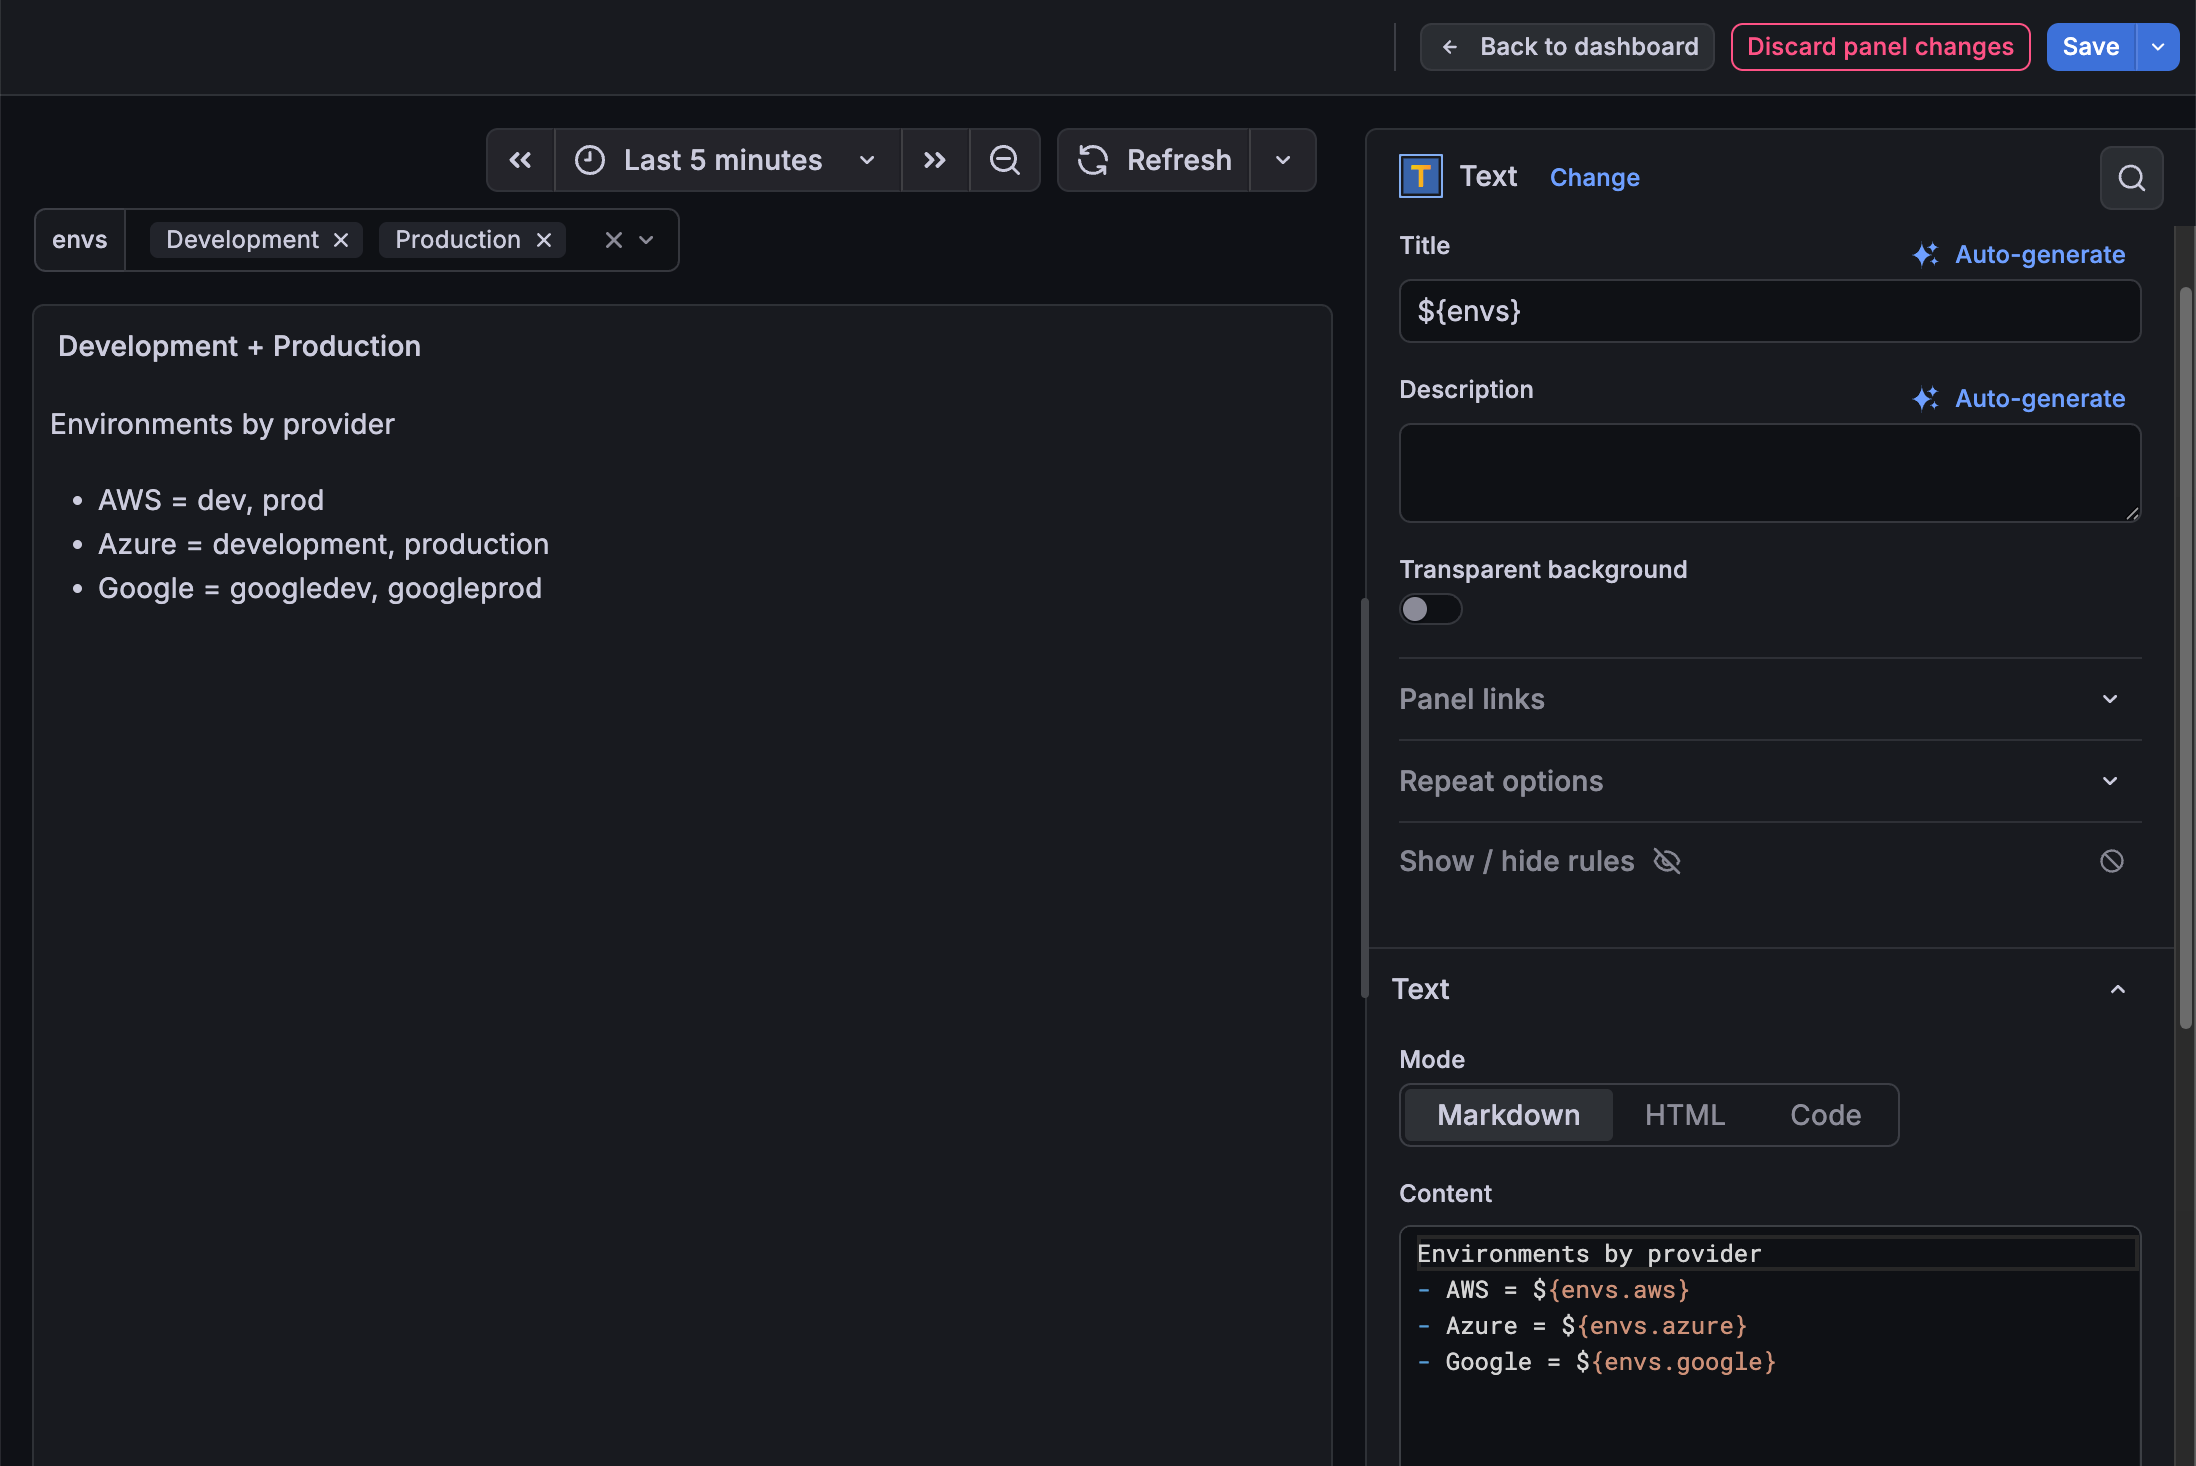
Then you can use ${varName.someProperty} syntax to reference any property in your dashboard panels or metrics:
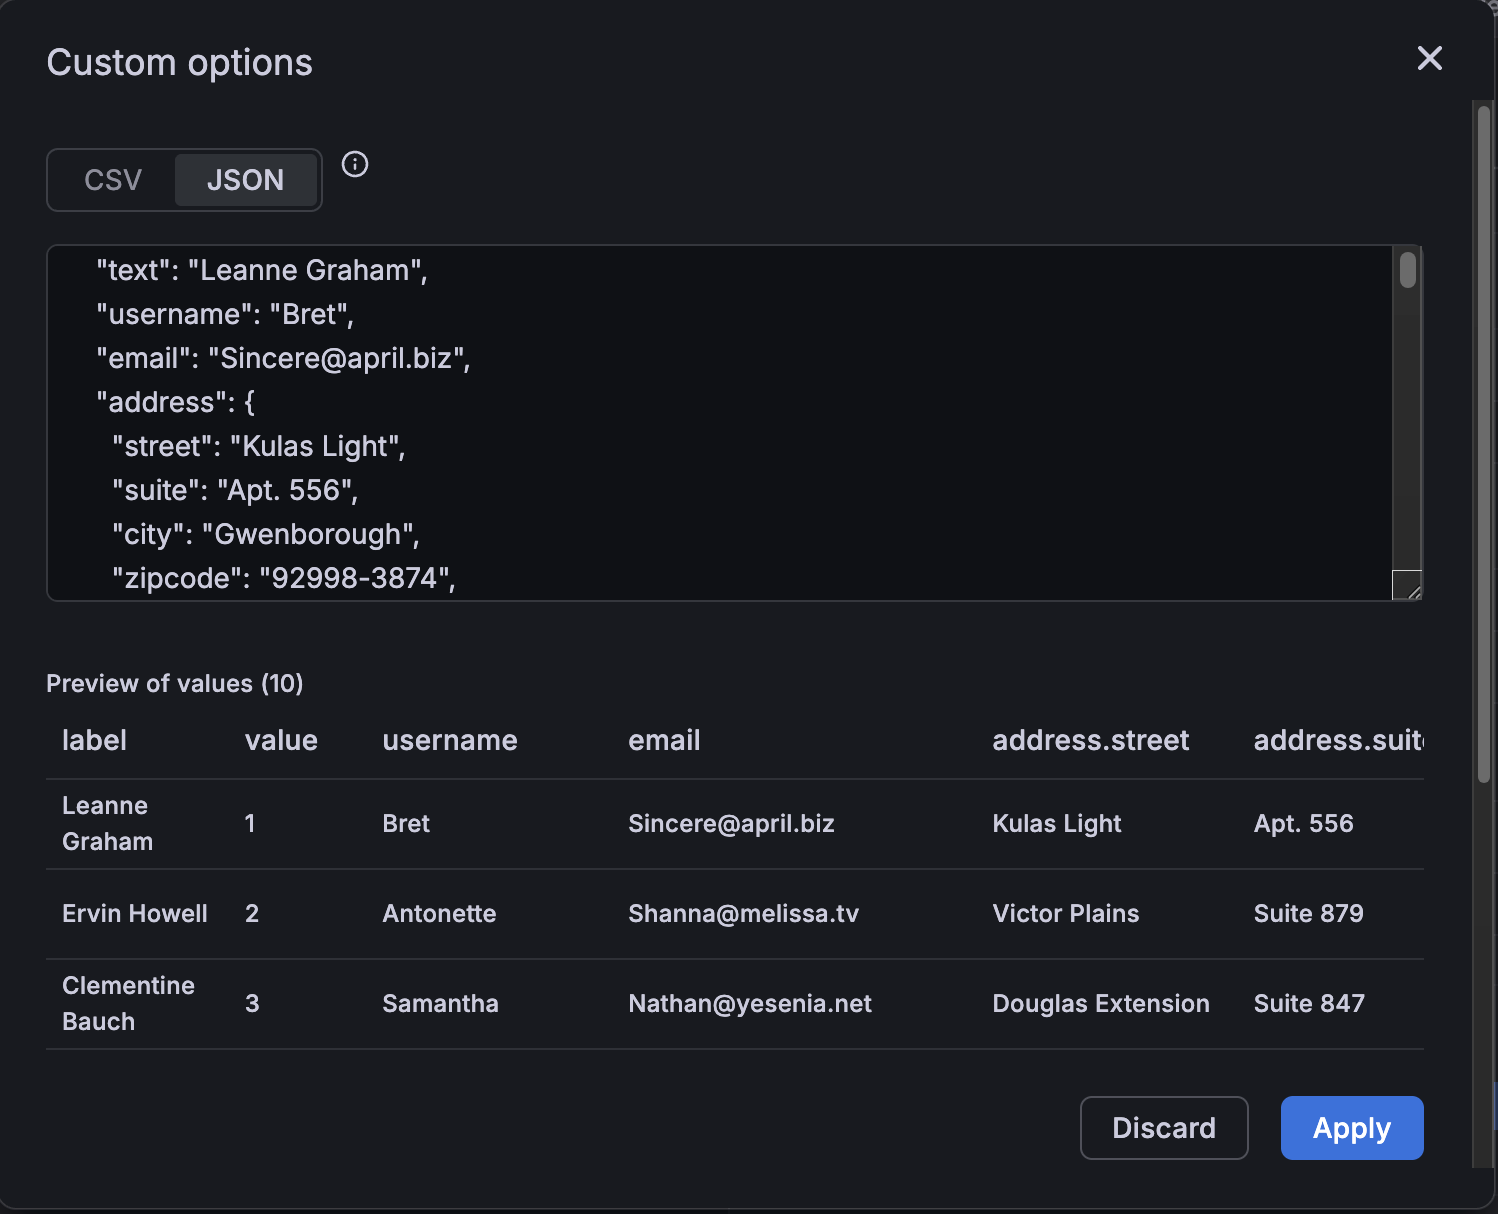
You can even deeply nest properties and still access them using familiar variable syntax. In the following example, each user has an address property with all the elements of an address nested within it:
Multi-property query variables
Because query configuration is different for each data source, there’s no one way to set up a JSON array to create a multi-property query variable. For PostgreSQL, refer to PostgreSQL template variables. For other data sources, refer to the relevant Data sources documentation for preinstalled data source plugins. For configuration information on all other data source plugins, refer to the Plugins documentation.
Chained variables
Chained variables, also called linked variables or nested variables, are query variables with one or more other variables in their variable query.
Chained variables create dependent relationships where the options available in one variable depend on the selections made in another. This pattern enables cascading filters that help users drill down through hierarchical data structures.
Cascading filter patterns are common in multi-tier filtering scenarios such as region > cluster > namespace > pod. Each level narrows the available options based on the previous selection, creating an intuitive navigation experience through your infrastructure or data hierarchy.
Technically, there is no limit to how many variables you can chain together, but the more links you have, the greater the query load.
Grafana Play dashboard examples
The following Grafana Play dashboards contain basic chained variables, only two layers deep. To view the variables and their settings, click Edit in the top-right corner of the dashboard, click the Dashboard options icon in the toolbar, and expand the Variables section. Both examples are expanded in the following section.
While the examples are data source-specific, the concepts can be applied broadly.
Graphite example explained
In this example, there are several applications. Each application has a different subset of servers. It’s based on the Graphite Templated Nested.
Now, you could make separate variables for each metric source, but then you have to know which server goes with which app. A better solution is to use one variable to filter another. In this example, when the user changes the value of the app variable, it changes the drop-down options returned by the server variable. Both variables use the Multi-value option and Include all option, enabling users to select some or all options presented at any time.
app variable
The query for this variable returns all the applications that exist.
apps.*The values returned are backend, country, fakesite, and All.
server variable
The query for this variable returns all servers for the currently selected application.
apps.$app.*If the user selects backend, then the query changes to:
apps.backend.*The query returns all servers associated with backend, including backend_01, backend_02, and so on.
If the user selects fakesite, then the query changes to:
apps.fakesite.*The query returns all servers associated with fakesite, including web_server_01, web_server_02, and so on.
More variables
Note
This example is theoretical. The Graphite server used in the example doesn’t contain CPU metrics.
The dashboard stops at two levels, but you could keep going. For example, if you wanted to get CPU metrics for selected servers, you could copy the server variable and extend the query so that it reads:
apps.$app.$server.cpu.*This query returns all the CPU metrics for the selected server.
Depending on what variable options the user selects, you could get queries like:
apps.backend.backend_01.cpu.*
apps.{backend.backend_02,backend_03}.cpu.*
apps.fakesite.web_server_01.cpu.*
InfluxDB example explained
In this example, you have several data centers. Each data center has a different subset of hosts. It’s based on the InfluxDB Templated dashboard.
In this example, when the user changes the value of the datacenter variable, it changes the drop-down options returned by the host variable. The host variable uses the Multi-value option and Include all option, allowing users to select some or all options presented at any time. The datacenter does not use either option, so you can only select one data center at a time.
datacenter variable
The query for this variable returns all the data centers that exist.
SHOW TAG VALUES WITH KEY = "datacenter"The values returned are America, Africa, Asia, and Europe.
host variable
The query for this variable returns all hosts for the currently selected data center.
SHOW TAG VALUES WITH KEY = "hostname" WHERE "datacenter" =~ /^$datacenter$/If the user selects America, then the query changes to:
SHOW TAG VALUES WITH KEY = "hostname" WHERE "datacenter" =~ /^America/The query returns all servers associated with America, including server1, server2, and so on.
If the user selects Europe, then the query changes to:
SHOW TAG VALUES WITH KEY = "hostname" WHERE "datacenter" =~ /^Europe/The query returns all servers associated with Europe, including server3, server4, and so on.
More variables
Note
This example is theoretical. The InfluxDB server used in the example doesn’t contain CPU metrics.
The dashboard stops at two levels, but you could keep going. For example, if you wanted to get CPU metrics for selected hosts, you could copy the host variable and extend the query so that it reads:
SHOW TAG VALUES WITH KEY = "cpu" WHERE "datacenter" =~ /^$datacenter$/ AND "host" =~ /^$host$/This query returns the CPU metrics for the selected host.
Depending on what variable options the user selects, you could get queries like:
SHOW TAG VALUES WITH KEY = "cpu" WHERE "datacenter" =~ /^America/ AND "host" =~ /^server2/
SHOW TAG VALUES WITH KEY = "cpu" WHERE "datacenter" =~ /^Africa/ AND "host" =~ /^server/7/
SHOW TAG VALUES WITH KEY = "cpu" WHERE "datacenter" =~ /^Europe/ AND "host" =~ /^server3+server4/
Best practices for chained variables
The following practices make your dashboards and variables easier to use.
New linked variables creation
- Chaining variables create parent/child dependencies. You can envision them as a ladder or a tree.
- The easiest way to create a new chained variable is to copy the variable that you want to base the new one on. In the variable list, click the Duplicate variable icon to the right of the variable entry to create a copy. You can then add on to the query for the parent variable.
- New variables created this way appear at the bottom of the list. You might need to drag it to a different position in the list to get it into a logical order.
Variable order
You can change the orders of variables in the dashboard variable list by clicking the up and down arrows on the right side of each entry. Grafana lists variable dropdowns left to right according to this list, with the variable at the top on the far left.
- List variables that don’t have dependencies at the top, before their child variables.
- Each variable should follow the one it’s dependent on.
- Remember there is no indication in the UI of which variables have dependency relationships. List the variables in a logical order to make it easier for others to use.
Complexity consideration
The more layers of dependency you have in variables, the longer it takes to update dashboards after you change variables.
For example, if you have a series of four linked variables (country, region, server, metric) and you change a root variable value (country), then Grafana must run queries for all the dependent variables before it updates the visualizations in the dashboard.
Filter variables with regular expressions
Using the Regex query option, you filter the list of options returned by the variable query or modify the options returned.
This section shows how to use a regular expression to filter or modify values in the variable drop-down list.
Using the Regex query option, you filter the list of options returned by the Variable query or modify the options returned. For more information, refer to the Mozilla guide on Regular expressions.
Examples of filtering on the following list of options:
backend_01
backend_02
backend_03
backend_04
Filter to return only the options that end with 01 or 02
Regex:
/(01|02)$/Result:
backend_01
backend_02
Filter and modify the options using a regular expression to capture group to return part of the text
Regex:
/.*(01|02)/Result:
01
02
Filter and modify: Prometheus Example
List of options:
up{instance="demo.robustperception.io:9090",job="prometheus"} 1 1521630638000
up{instance="demo.robustperception.io:9093",job="alertmanager"} 1 1521630638000
up{instance="demo.robustperception.io:9100",job="node"} 1 1521630638000Regex:
/.*instance="([^"]*).*/Result:
demo.robustperception.io:9090
demo.robustperception.io:9093
demo.robustperception.io:9100
Filter and modify using named text and value capture groups
Using named capture groups, you can capture separate ’text’ and ‘value’ parts from the options returned by the variable query. This allows the variable drop-down list to contain a friendly name for each value that can be selected.
For example, when querying the node_hwmon_chip_names Prometheus metric, the chip_name is a lot friendlier than the chip value. So the following variable query result:
node_hwmon_chip_names{chip="0000:d7:00_0_0000:d8:00_0",chip_name="enp216s0f0np0"} 1
node_hwmon_chip_names{chip="0000:d7:00_0_0000:d8:00_1",chip_name="enp216s0f0np1"} 1
node_hwmon_chip_names{chip="0000:d7:00_0_0000:d8:00_2",chip_name="enp216s0f0np2"} 1
node_hwmon_chip_names{chip="0000:d7:00_0_0000:d8:00_3",chip_name="enp216s0f0np3"} 1
Passed through the following regular expression:
/chip_name="(?<text>[^"]+)|chip="(?<value>[^"]+)/gWould produce the following drop-down list:
Display Name          Value
------------          -------------------------
enp216s0f0np0         0000:d7:00_0_0000:d8:00_0
enp216s0f0np1         0000:d7:00_0_0000:d8:00_1
enp216s0f0np2         0000:d7:00_0_0000:d8:00_2
enp216s0f0np3         0000:d7:00_0_0000:d8:00_3
Note
Only
textandvaluecapture group names are supported.


