
This is documentation for the next version of Grafana. For the latest stable release, go to the latest version.
Candlestick
The candlestick visualization allows you to visualize data that includes a number of consistent dimensions focused on price movement. The candlestick visualization includes an Open-High-Low-Close (OHLC) mode, as well as support for additional dimensions based on time series data.

Candlestick visualizations build upon the foundation of the time series visualization and include many common configuration settings.
Mode
The mode options allow you to toggle which dimensions are used for the visualization.
- Candles limits the panel dimensions to the open, high, low, and close dimensions used by candlestick visualizations.
- Volume limits the panel dimension to the volume dimension.
- Both is the default behavior for the candlestick visualization. It includes both candlestick and volume visualizations.
Candle style
- Candles is the default display style and creates candle-style visualizations between the open and close dimensions.
- OHLC Bars displays the four core dimensions open, high, low, and close values.
Color strategy
- Since Open is the default behavior. This mode will utilize the Up color (below) if the intra-period price movement is positive. In other words, if the value on close is greater or equal to the value on open, the Up color is used.
- Since Prior Close is an alternative display method based where the color of the candle is based on the inter-period price movement or change in value. In other words, if the value on open is greater than the previous value on close, the Up color is used. If the value on open is lower than the previous value on close, the Down color is used. This option also triggers the hollow candlestick visualization mode. Hollow candlesticks indicate that the intra-period movement is positive (value is higher on close than on open), filled candlesticks indicate the intra-period change is negative (value is lower on close than on open). To learn more, see the explanation of the differences.
Up & Down Colors
The Up color and Down color options select which colors are used when the price movement is up or down. Please note that the Color strategy above will determine if intra-period or inter-period price movement is used to select the candle or OHLC bar color.
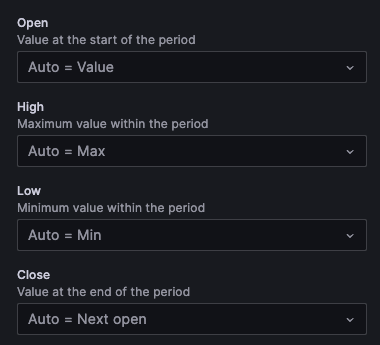
Open, High, Low, Close
The candlestick visualization will attempt to map fields from your data to the appropriate dimension:
- Open corresponds to the starting value of the given period.
- High corresponds to the highest value of the given period.
- Low corresponds to the lowest value of the given period.
- Close corresponds to the final (end) value of the given period.
- Volume corresponds to the sample count in the given period. (for example, number of trades)
Note
The candlestick visualization legend doesn’t display these values.
To properly map these dimensions, the query results table from your data must include at least the following columns:
- timestamp
- open
- high
- low
- close
If your data can’t be mapped to these dimensions for some reason (for example, because the column names aren’t the same), you can map them manually using the Open, High, Low, and Close fields under the Candlestick options in the panel editor:
Additional fields
The candlestick visualization is based on the time series visualization. It can visualize additional data dimensions beyond open, high, low, close, and volume The Include and Ignore options allow it to visualize other included data such as simple moving averages, Bollinger bands and more, using the same styles and configurations available in the [time series][] visualization.
Was this page helpful?
Related resources from Grafana Labs


