
Menu
This is documentation for the next version of Grafana. For the latest stable release, go to the latest version.
Grafana Cloud
Enterprise
Open source
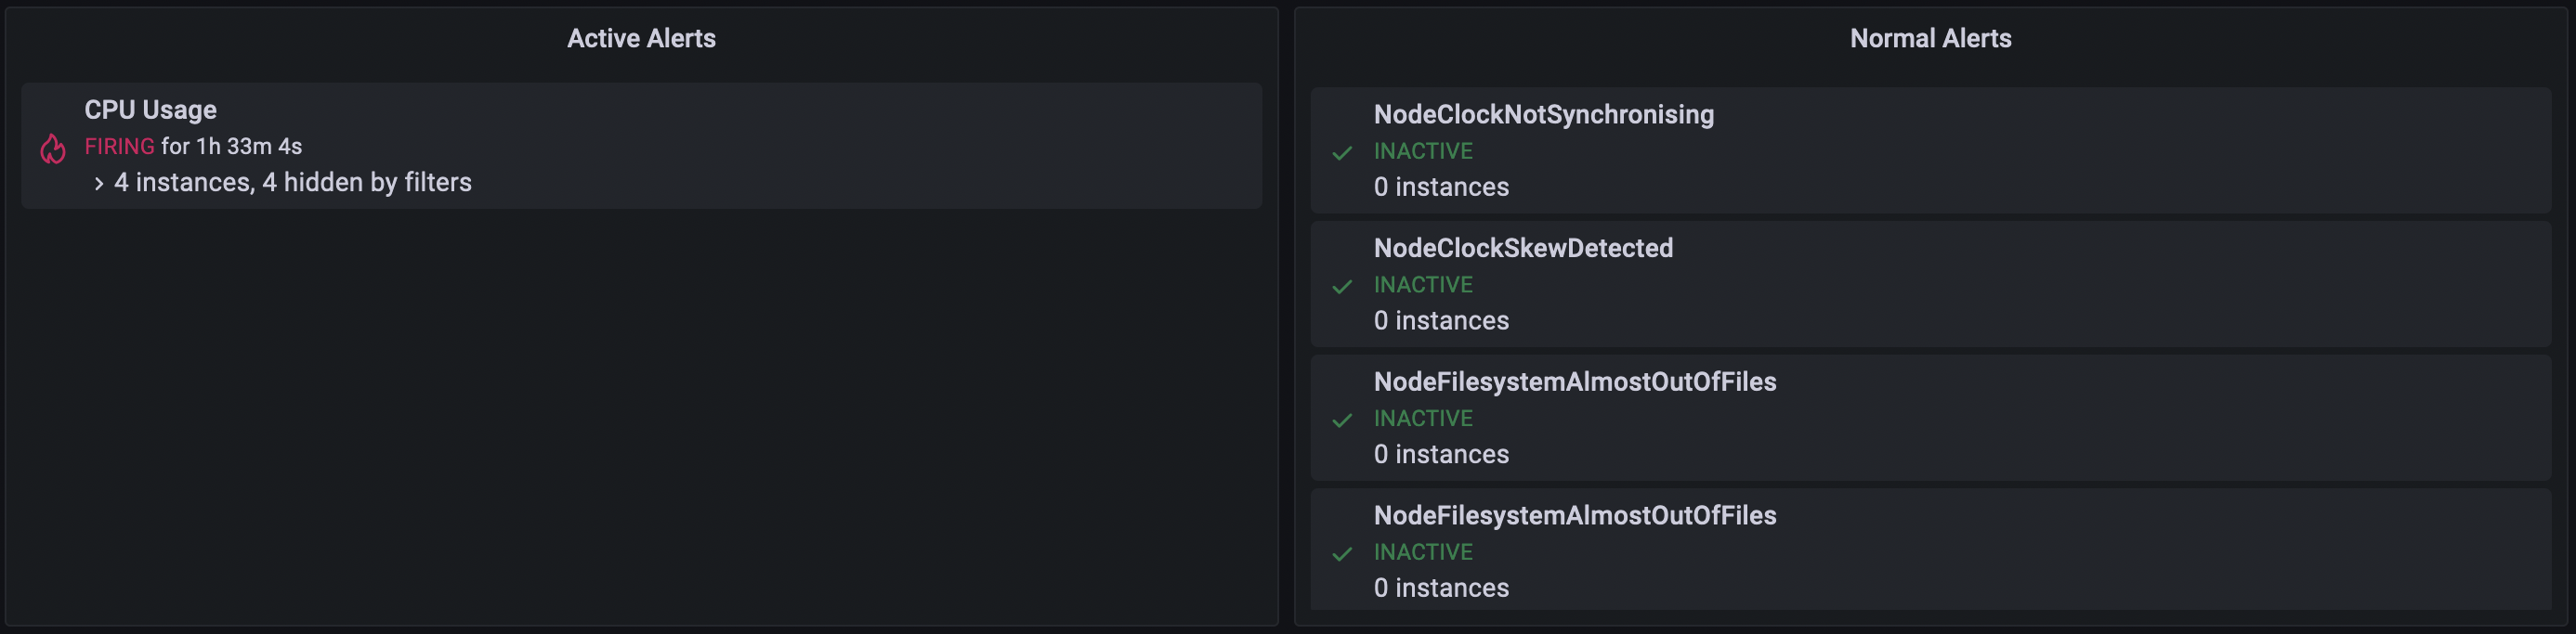
Alert list
Use alert lists to display your alerts. You can configure the list to show the current state. You can read more about alerts in Grafana Alerting overview.
Customize your visualization using the following settings.
Options
- Group mode - Choose between “Default grouping” to show alert instances grouped by their alert rule, or “Custom grouping” to group alert instances by a custom set of labels.
- Max Items - Sets the maximum number of alerts to list.
- Sort order - Select how to order the alerts displayed:
- Alphabetical (asc) - Alphabetical order.
- Alphabetical (desc) - Reverse alphabetical order.
- Importance - By importance according to the following values, with 1 being the highest:
- alerting: 1
- firing: 1
- no_data: 2
- pending: 3
- ok: 4
- paused: 5
- inactive: 5
- Time (asc) - Newest active alert instances first.
- Time (desc) - Oldest active alert instances first.
- Alerts from this dashboard - Shows alerts only from the dashboard the alert list is in.
Filter
These options allow you to limit alerts shown to only those that match the query, folder, or tags you choose.
- Alert name - Enter an alert name query.
- Alert instance label - Filter alert instances using label querying, ex:
{severity="critical", instance=~"cluster-us-.+"}. - Folder - Select a folder. Only alerts from dashboards in the folder selected will be displayed.
- Datasource - Filter alerts from the selected data source.
State filter
Choose which alert states to display in this visualization.
- Alerting / Firing
- Pending
- No Data
- Normal
- Error
Was this page helpful?
Related resources from Grafana Labs

Getting started with the Grafana LGTM Stack
In this webinar, we’ll demo how to get started using the LGTM Stack: Loki for logs, Grafana for visualization, Tempo for traces, and Mimir for metrics.

Getting started with Grafana dashboard design
In this webinar, you'll learn how to design stylish and easily accessible Grafana dashboards that tell a story.

Building advanced Grafana dashboards
In this webinar, we’ll demo how to build and format Grafana dashboards.