
Menu
This is documentation for the next version of Grafana. For the latest stable release, go to the latest version.
Grafana Cloud
Enterprise
Open source
Panel editor
In the panel editor, you can update all the elements of a visualization including the data source, queries, time range, and visualization display options.
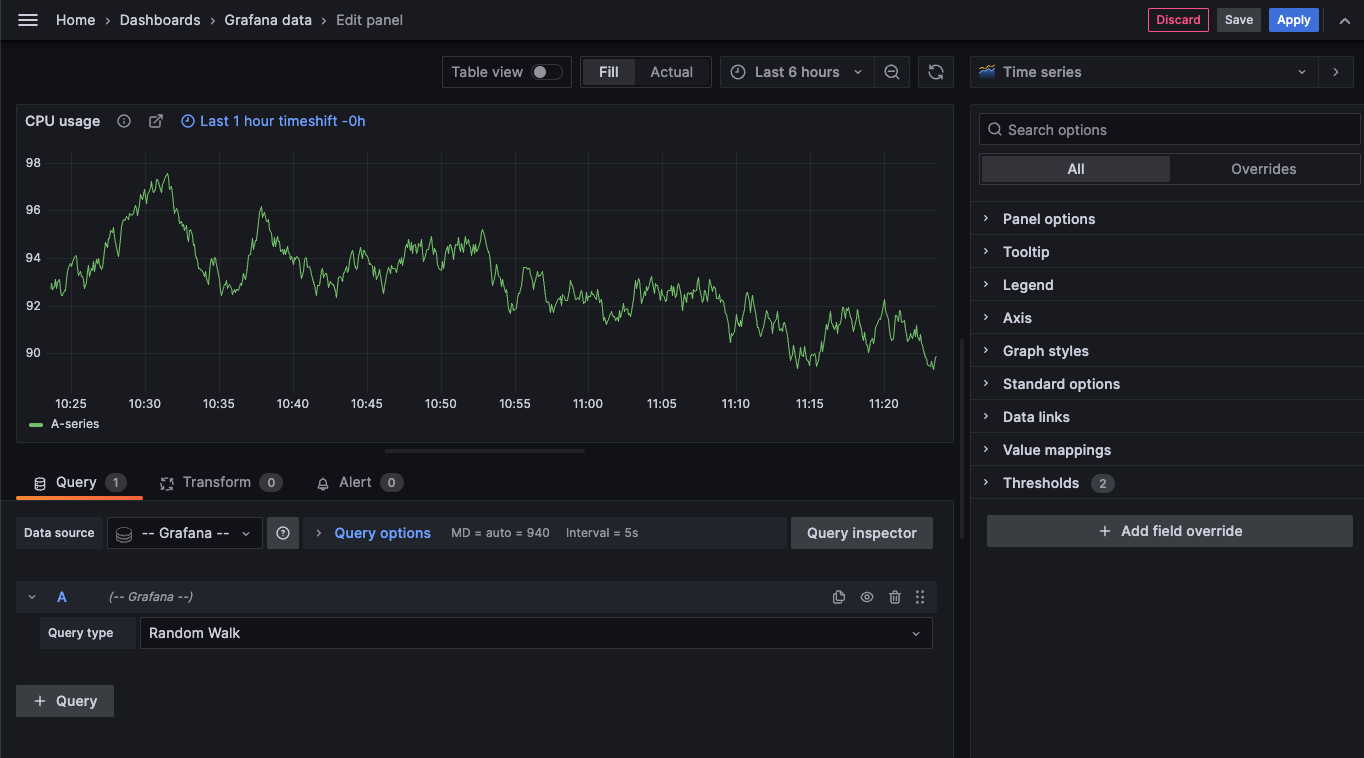
This following sections describe the areas of the Grafana panel editor.
Panel header
The header section lists the dashboard in which the panel appears and the following controls:
- Discard: Discards changes you have made to the panel since you last saved the dashboard.
- Save: Saves changes you made to the panel.
- Apply: Applies changes you made and closes the panel editor, returning you to the dashboard. You’ll have to save the dashboard to persist the applied changes.
Visualization preview
The visualization preview section contains the following options:
- Table view: Convert any visualization to a table so you can see the data. Table views are helpful for troubleshooting. This view only contains the raw data. It doesn’t include transformations you might have applied to the data or the formatting options available in the Table visualization.
- Fill: The visualization preview fills the available space. If you change the width of the side pane or height of the bottom pane the visualization changes to fill the available space.
- Actual: The visualization preview has the exact size as the size on the dashboard. If not enough space is available, the visualization scales down preserving the aspect ratio.
- Time range controls: Default is either the browser local timezone or the timezone selected at a higher level.
Data section
The data section contains tabs where you enter queries, transform your data, and create alert rules (if applicable).
- Query tab: Select your data source and enter queries here. For more information, refer to Add a query. When you create a new dashboard, you’ll be prompted to select a data source before you get to the panel editor. You set or update the data source in existing dashboards using the drop-down in the Query tab.
- Transform tab: Apply data transformations. For more information, refer to Transform data.
- Alert tab: Write alert rules. For more information, refer to the overview of Grafana Alerting.
Panel display options
The display options section contains tabs where you configure almost every aspect of your data visualization.
Was this page helpful?
Related resources from Grafana Labs

Getting started with the Grafana LGTM Stack
In this webinar, we’ll demo how to get started using the LGTM Stack: Loki for logs, Grafana for visualization, Tempo for traces, and Mimir for metrics.

Getting started with Grafana dashboard design
In this webinar, you'll learn how to design stylish and easily accessible Grafana dashboards that tell a story.

Building advanced Grafana dashboards
In this webinar, we’ll demo how to build and format Grafana dashboards.