
This is documentation for the next version of Grafana documentation. For the latest stable release, go to the latest version.

Query profile data
You can query your profile data using the open source Grafana Profiles Drilldown app or the built-in Pyroscope data source query editor.
- Profiles Drilldown provides a queryless experience for inspecting your profiling data with opinionated workflows to assist your investigation.
- Data source query editor provides complete control over your data exploration and is recommended for experienced users.
In addition, you can embed flame graph panels in Grafana dashboards. Refer to the Flame graph panel documentation for details.
Profiles Drilldown
Grafana Profiles Drilldown is a native Grafana application designed to integrate seamlessly with Pyroscope, the open source continuous profiling platform, providing a smooth, queryless experience for browsing and analyzing profiling data.
You can use Profiles Drilldown in Grafana Cloud or in your own Grafana instance. For more information, refer to Access or install Profiles Drilldown.

Use cases
There are several different modes for viewing, analyzing, and comparing profiling data.
The main use cases are the following:
- Proactive: Cutting costs, addressing latency issues, or optimizing memory usage for applications
- Reactive: Resolving incidents with line-level accuracy or debugging active latency/memory issues
Profiles Drilldown provides an intuitive interface to specifically support proactive and reactive use cases. You get a holistic view of all of your services and how they’re functioning, but also the ability to drill down for more targeted root cause analysis.
Profiles Drilldown offers a convenient platform to analyze profiles and get insights that are impossible to get from using other traditional signals like logs, metrics, or tracing.

With Grafana Play, you can explore and see how it works, learning from practical examples to accelerate your development. This feature can be seen on the Grafana Play site.
Pyroscope query editor
The Pyroscope data source query editor gives you access to a profile type selector, a label selector, and collapsible options.
Like Profiles Drilldown, the query editor also provides a flame graph to visualize data.

To access the query editor:
Sign into Grafana or Grafana Cloud.
Select your Pyroscope data source.
From the menu, choose Explore.
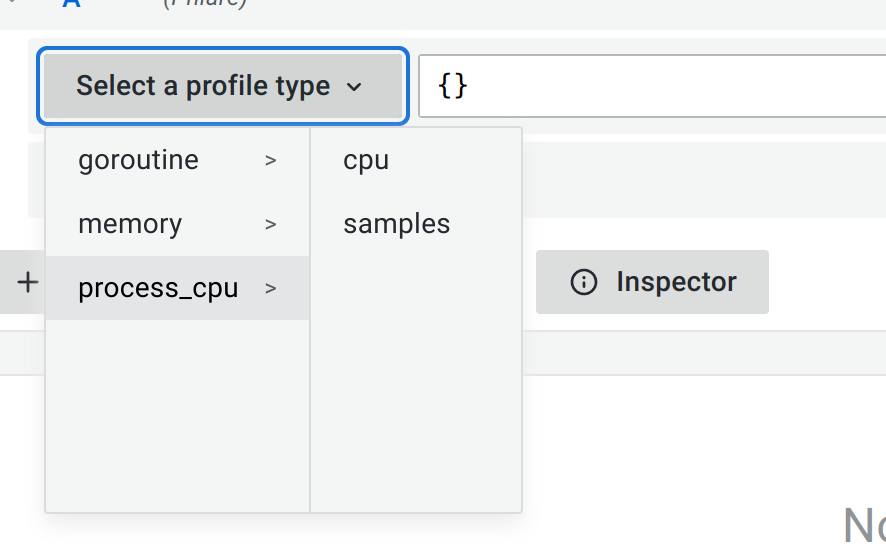
Select a profile type from the drop-down menu.

Profile selector Use the labels selector input to filter by labels. Pyroscope uses similar syntax to Prometheus to filter labels. Refer to Label selector syntax for available operators and syntax.
While the label selector can be left empty to query all profiles without filtering by labels, you must select a profile type or app for the query to be valid.
Grafana doesn’t show any data if the profile type or app isn’t selected when a query runs.
![Labels selector]()
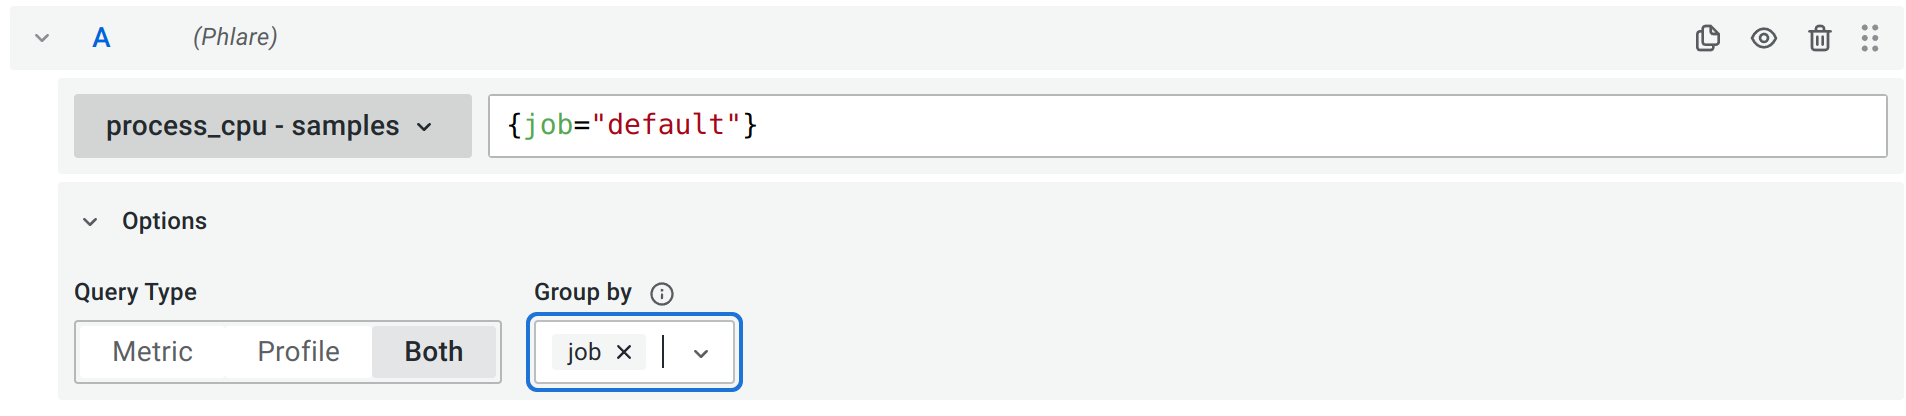
Expand the Options section to view the available query options.
![Options section]()

Label selector syntax
The label selector uses a syntax similar to Prometheus. Enclose one or more label matchers in curly braces, separated by commas. Each matcher combines a label name, an operator, and a value in double quotes.
The label selector supports the following operators.
The following examples show common label selectors:
{service_name="my-service"}
{service_name="my-service", namespace="production"}
{service_name=~"cart.*"}
{service_name="checkout", namespace!="staging"}
Leave the label selector empty, or set it to {}, to query all profiles for the selected profile type without filtering by labels.
Query options
The Options section provides the following settings.
Select a query type to return the profile data. Data is shown in the Flame Graph, metric data visualized in a graph, or both.
Using Group by, you can group metric data by a specified label. You can use multiple labels to group by.
In conjunction with Group by, you can set a positive number in the Limit input to limit the maximum number of time series returned by the data source.
Exemplars
The Exemplars toggle in the Options section links individual profile samples to points on a metrics graph, so you can jump from a spike in a time series to the specific profile that produced it.
Heatmap
When the profilesHeatmap feature is enabled, a Heatmap toggle appears in the Options section.
The heatmap visualizes the distribution of profile samples over time, which helps you spot patterns and outliers across many profiles.
When you enable Heatmap, use the Heatmap Type option to choose how samples are aggregated:
- Individual: Shows individual profile samples.
- Span: Aggregates samples by span duration, for use with Trace to profiles.
Note
The
profilesHeatmapfeature is experimental. Experimental features are subject to change and may be removed in a future release. Enable it using theprofilesHeatmapfeature toggle.
UTF-8 label names
When the pyroscopeUTF8LabelNames feature is enabled, the label selector supports UTF-8 label names.
Enclose label names that contain characters such as dots in double quotes, for example, {"k8s.namespace"="production"}.
The pyroscopeUTF8LabelNames feature is in public preview and enabled by default.
Query examples
The following examples show common ways to build queries in the query editor. Each example lists the profile type to select and the label selector to enter.
Investigate high CPU usage for a service:
Select the process_cpu:cpu:nanoseconds:cpu:nanoseconds profile type and filter to the affected service:
{service_name="checkout"}Set Query Type to Both in Explore to view the CPU flame graph alongside a time series of CPU usage.
Compare memory allocations across environments:
Select the memory:alloc_space:bytes:space:bytes profile type, set Query Type to Metric, and set Group by to namespace:
{service_name="cart"}The metrics graph shows a separate time series for each namespace, which lets you compare allocation behavior between environments such as production and staging.
Analyze goroutine growth:
Select the goroutine:goroutine:count:goroutine:count profile type to inspect the number of goroutines and where they’re created:
{service_name=~"api.*"}View the profile for a specific trace span:
Select a profile type, set Query Type to Profile, and enter the span ID in the Span ID field, for example, 64f170a95f537095. The flame graph then shows only the profile data associated with that span. This example supports
Trace to profiles.
Profiles query results
Profiles can be visualized in a flame graph. Refer to the Flame Graph documentation to learn about the visualization and its features.
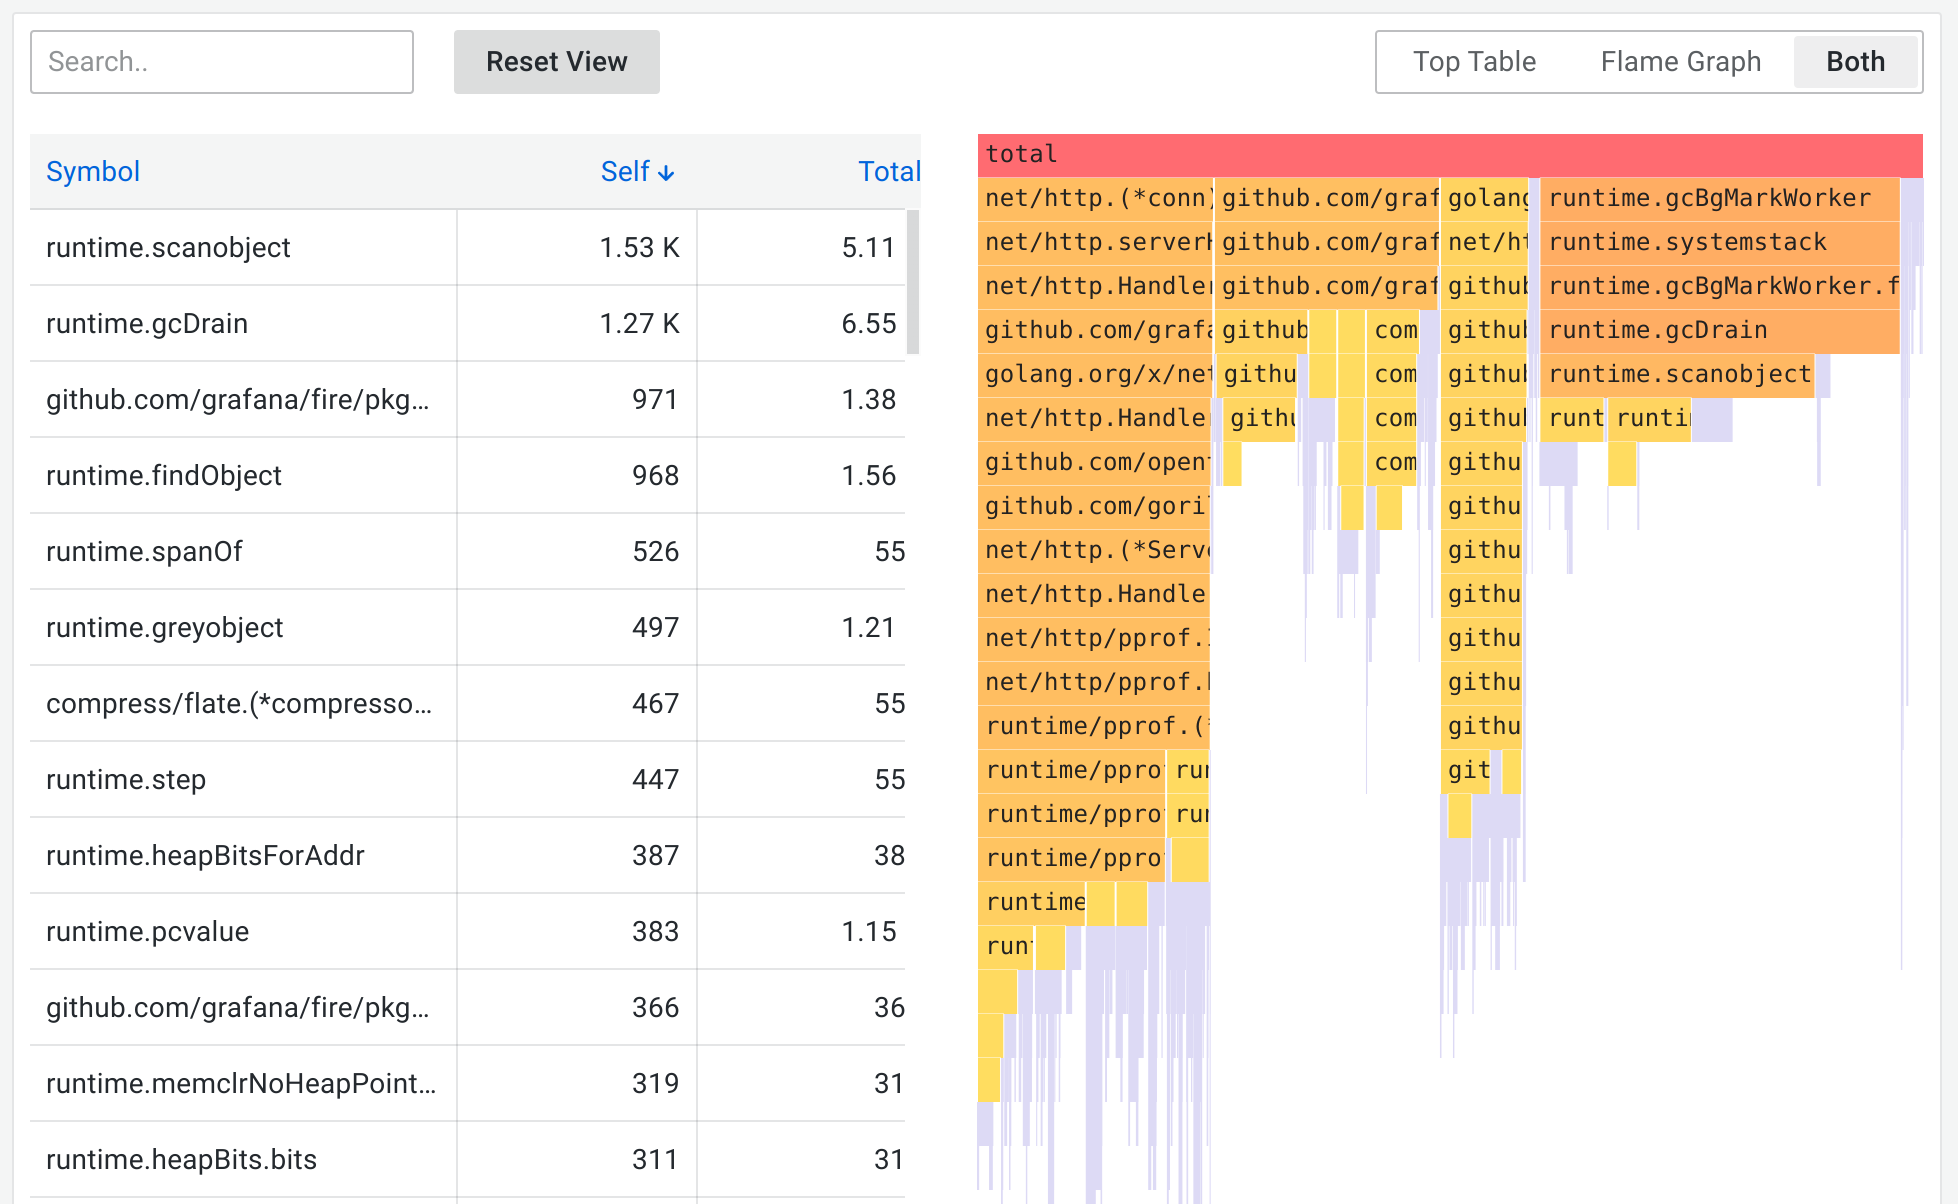
Pyroscope returns profiles aggregated over a selected time range. The absolute values in the flame graph grow as the time range gets bigger while keeping the relative values meaningful. You can zoom in on the time range to get a higher granularity profile up to the point of a single scrape interval.
Metrics query results
Metrics results represent the aggregated sum value over time of the selected profile type.
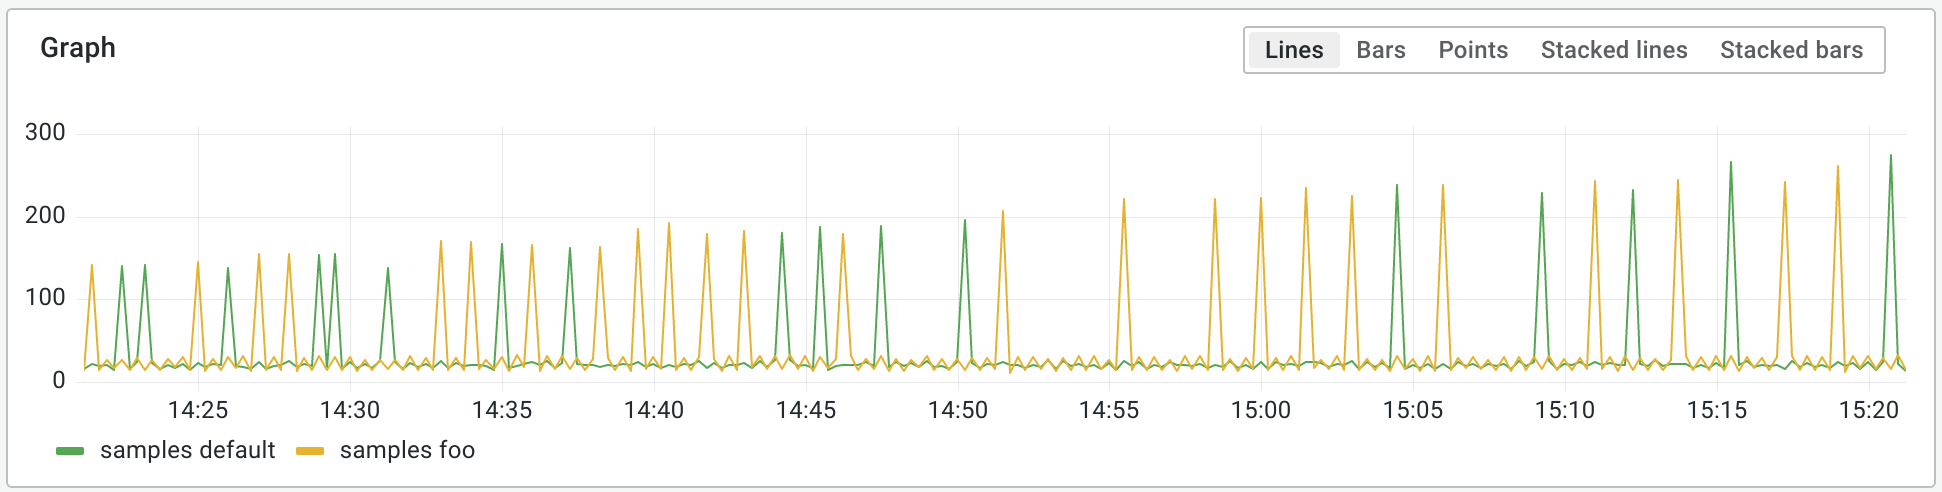
This allows you to quickly see any spikes in the value of the scraped profiles and zoom in to a particular time range.
Next steps
Was this page helpful?
Related resources from Grafana Labs



