
This is documentation for the next version of Grafana documentation. For the latest stable release, go to the latest version.

Pyroscope data source
Grafana Pyroscope is a horizontally scalable, highly available, multi-tenant, OSS, continuous profiling aggregation system. Add a Pyroscope data source to query your profiles in Explore.
Grafana includes built-in support for Pyroscope, so you don’t need to install a plugin. The Pyroscope data source requires Grafana v12.3 or later.
Refer to Introduction to Pyroscope to understand profiling and Pyroscope.
Supported features
The Pyroscope data source supports the following features.
The Pyroscope data source returns profiling data visualized as flame graphs and time-series metrics derived from profiles. It also integrates with tracing data through the Trace to profiles feature.
Get started
The following documents help you get started with the Pyroscope data source:
- Configure the Pyroscope data source
- Query profile data
- Template variables
- Troubleshoot the Pyroscope data source
Before you query profiles, configure your application to send profiles to Pyroscope.
To explore profiling data from a Pyroscope data source, try Grafana Profiles Drilldown on Grafana Play:
With Grafana Play, you can explore and see how it works, learning from practical examples to accelerate your development. This feature can be seen on Grafana Profiles Drilldown.
Continuous profiling
While code profiling has been a long-standing practice, continuous profiling represents a modern and more advanced approach to performance monitoring.
This technique adds two critical dimensions to traditional profiles:
- Time
- Profiling data is collected continuously, providing a time-centric view that allows querying performance data from any point in the past.
- Metadata
- Profiles are enriched with metadata, adding contextual depth to the performance data.
These dimensions, coupled with the detailed nature of performance profiles, make continuous profiling a uniquely valuable tool.
Flame graphs
Flame graphs help you visualize resource allocation and performance bottlenecks. For more information about the visualization and its features, refer to the Flame graph panel.
Grafana Cloud-only features
Some Pyroscope features are available only in Grafana Cloud:
- Explain flame graph: On views with a flame graph, Grafana Cloud provides an AI-driven analysis that explains the performance bottleneck, its root cause, and a recommended fix. For more information, refer to Flame graph AI.
- GitHub line-level insights: Through the GitHub integration, Grafana Cloud maps profiling data to your source code and shows line-level performance insights.
Integrate profiles into dashboards
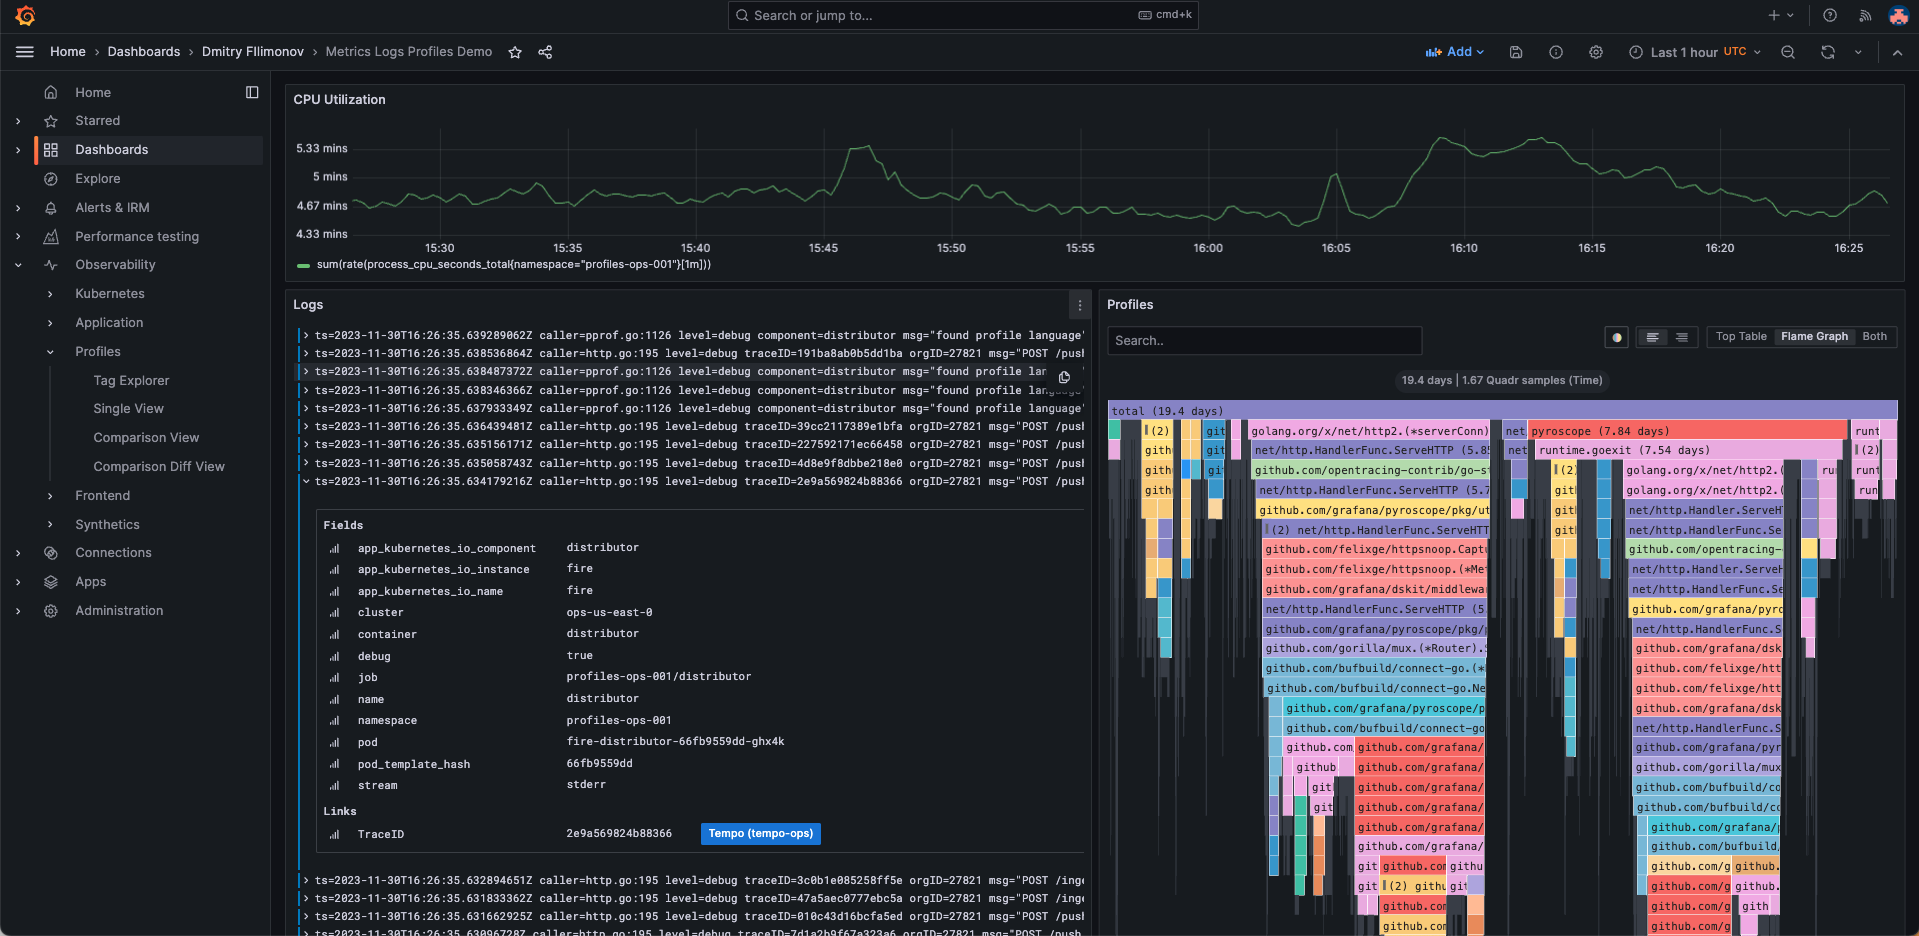
Using the Pyroscope data source, you can integrate profiles into your dashboards. For example, you can embed flame graphs using the flame graph panel.
This example shows memory profiles alongside panels for logs and metrics, which helps you debug out of memory (OOM) errors together with the associated logs and metrics.
Visualize traces and profiles data using Trace to profiles
You can link profile and tracing data using your Pyroscope data source with the Tempo data source.
Combined traces and profiles let you see granular line-level detail when available for a trace span. This allows you to pinpoint the exact function that’s causing a bottleneck in your application as well as a specific request.
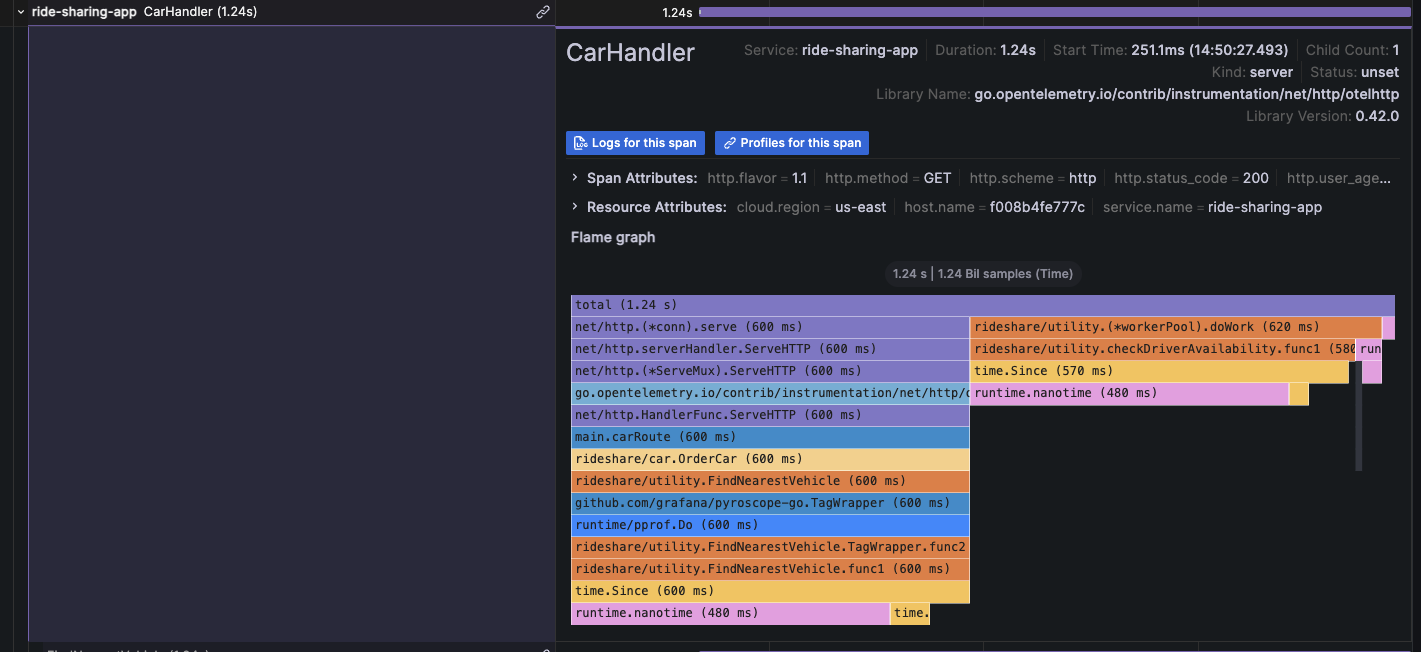
For more information, refer to Configure Trace to profiles and Link tracing and profiling with span profiles.
Query with the Grafana CLI
You can query this data source from the command line and from AI coding agents using the Grafana CLI, gcx. gcx gives you and your agent structured, terminal-based access to your Grafana data sources, which is useful for automation and agent-driven investigations.
gcx supports Grafana Cloud and Grafana OSS or Enterprise v12 and later. Before you query, install and authenticate gcx. Refer to the
gcx CLI documentation for installation, configuration, and the full command reference.
For example, to run a profiling query against your Pyroscope data source, use gcx datasources pyroscope query:
gcx datasources pyroscope query -d <DATASOURCE_UID> '{service_name="frontend"}' \
  --profile-type process_cpu:cpu:nanoseconds:cpu:nanoseconds --since 1h
Replace <DATASOURCE_UID> with the UID of your Pyroscope data source. The query takes a label selector ({service_name="frontend"}), a profile type (--profile-type), and a time range (--since).
Related Pyroscope documentation
For more information about Pyroscope beyond the data source, refer to the following Pyroscope product documentation:
- Introduction to Pyroscope: Understand continuous profiling and how Pyroscope works.
- Configure the client to send profiles: Instrument your application to send profiling data to Pyroscope.
- Link traces to profiles with span profiles: Correlate trace spans with profiling data.
- Deploy Pyroscope: Deploy and run a self-managed Pyroscope backend.
- Configure the Pyroscope server: Reference the available server configuration parameters.
Was this page helpful?
Related resources from Grafana Labs



