This is documentation for the next version of Grafana documentation. For the latest stable release, go to the latest version.
Data sources, plugins, and integrations
When working with Grafana, you’ll encounter three key concepts: data sources, plugins, and integrations. Each one is essential in building effective monitoring solutions, but they serve distinct purposes, and are often confused with one another. This document clarifies the meaning of each concept and what each one does, when to use it, and how they work together to create observability solutions in Grafana.
The most important thing to remember: every data source is powered by a plugin. You install a plugin, then configure a data source. Core plugins like Prometheus come bundled with Grafana.
Data sources
A data source is a connection to a specific database, monitoring system, service, or other external location that stores metrics, logs, traces, or other data. Examples include Prometheus, InfluxDB, PostgreSQL, and Amazon CloudWatch.
When you configure a data source in Grafana, you provide connection details, credentials, and endpoints that tell Grafana where to fetch data from. Data sources are the foundation for working with Grafana, without them, Grafana has nothing to visualize.
Every data source is powered by a data source plugin. Grafana comes bundled with core data source plugins (like Prometheus, Loki, and MySQL), and hundreds more are available in the plugin catalog for systems ranging from databases and cloud providers to tools like Jira, GitHub, and Datadog. After you configure a data source, you can query it to build dashboards. For example, you can query a Prometheus data source to display CPU metrics or query CloudWatch to visualize AWS infrastructure performance.
Plugins
A plugin extends the core functionality of Grafana. Plugins can add new data source types, visualization panels, or full-featured applications that integrate with Grafana. They make Grafana modular and extensible.
Plugins come in three types:
Data source plugins enable Grafana to connect to specific types of databases or services. Core data source plugins like Prometheus, Loki, and MySQL come bundled with Grafana. You can install additional data source plugins to connect to other systems. Examples include MSSQL, Databricks, and MongoDB.
Panel plugins control how data appears in Grafana dashboards. While Grafana comes with several built-in panel types (like graphs, single stats, and tables), panel plugins extend this by providing specialized ways to display data. Examples include pie chart, candlestick, and traffic light. Note that in some cases, panels don’t rely on a data source at all. The Text panel can render static or templated content without querying data. Panels can also support user-driven actions. For example, the Button panel can trigger workflows or external calls.
App plugins package data sources, panels, and custom pages into a single install. When you add an app plugin, you get a purpose-built experience for a specific use case. For example, the Azure Cloud Native Monitoring app gives you pre-configured data sources, dashboards, and a dedicated management page for your Azure environment, all in one install. If you’re a developer, you can also build your own app plugin.
Integrations
Integrations are exclusive to Grafana Cloud. Integrations are pre-packaged monitoring solutions that bundle data collection instructions, pre-built dashboards, and alert and recording rules. They support metrics, logs, and traces. Unlike standalone data sources, integrations provide tested configuration and ready-to-use dashboards and alerts. For example, a Linux integration provides instructions and configuration for collecting metrics and logs from your hosts, creates dashboards for monitoring, and sets up common alerts—all working together out of the box.
When to use each
Use a data source when:
- You want to connect Grafana to a specific system (for example, Prometheus or MySQL).
- You’re building custom dashboards with hand-picked metrics and visualizations.
- Your monitoring needs are unique or not covered by pre-packaged integrations.
Use a plugin when:
- You need to connect to a system Grafana doesn’t support natively.
- You want to add new functionality (visualizations, workflows, or app-style extensions).
- You have specialized or industry-specific requirements (for example, IoT).
Use an integration when:
- You’re using Grafana Cloud and want a quick, pre-built setup.
- You prefer minimal configuration with ready-to-use dashboards and alerts.
- You’re new to observability and want to learn what good monitoring looks like.
Relationships and interactions
Data sources, plugins, and integrations work together to build observability solutions. The following diagram shows two paths: the custom path where you install plugins and configure data sources yourself, and the integration path where Grafana Cloud provides a pre-packaged setup.
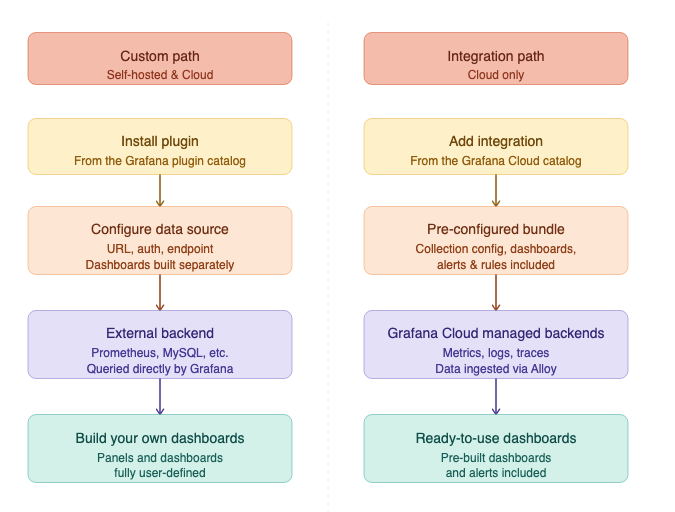
App plugins can combine both paths by bundling data source plugins, panel plugins, and custom pages into a single package.
The following examples show how these concepts work together in practice:
Grafana includes a built-in Prometheus data source plugin. Configure a Prometheus data source by providing your server URL, then build a dashboard with a time series panel to monitor CPU usage across your hosts.
Install the Databricks data source plugin. Configure the Databricks data source and run SQL queries against your Databricks workspace. Use the
Histogrampanel to visualize distributions in your query results, such as latency buckets, job durations, or model output scores.Install the Redis Application app plugin. This app provides a unified experience for monitoring Redis by working with your existing Redis data source. It adds custom pages for configuration and exploration, along with prebuilt dashboards, commands, and visualizations that help you analyze performance, memory usage, and key activity.
If you’re using Grafana Cloud, add the ClickHouse integration. This integration provides pre-built dashboards and alerts to monitor ClickHouse cluster metrics and logs, so you can visualize and analyze ClickHouse performance and health.
Frequently asked questions
What’s the difference between a data source and a data source plugin?
A data source plugin is a software component that enables Grafana to communicate with specific types of databases or services, like Prometheus, MySQL, or InfluxDB. A data source is an actual configured connection to one of these databases, including the credentials, URL, and settings needed to retrieve data.
Think of it this way: You install a plugin but configure a data source.
Do I need a plugin to use a data source?
You must install the plugin before you configure or use the data source. Each data source plugin has its own versioning and lifecycle. Grafana includes built-in core data sources, which can be thought of as pre-installed plugins.
Can I use integrations in self-managed Grafana?
No, integrations are exclusive to Grafana Cloud. In self-managed Grafana, you can replicate similar setups manually using data sources and dashboards.
Aren’t integrations just pre-built dashboards?
No, integrations are much more than just dashboards. While dashboards are part of an integration, they’re only one piece. Integrations typically include:
- Data collection setup (for example, pre-configured agents or exporters).
- Predefined metrics and queries tailored to the technology.
- Alerting rules and notifications to help detect common issues.
- Dashboards to visualize and explore that data.
How do data sources and integrations differ in how they handle data?
Data sources query data where it already lives. They connect Grafana to an external system or database, such as Prometheus, MySQL, or Elasticsearch, and fetch data on demand. You keep full control over your own data stores, schemas, and retention policies.
In contrast, integrations focus on getting data into Grafana Cloud’s managed backends for metrics, logs, and traces. They ingest telemetry using pre-configured agents and pipelines. Instead of querying an external database, Grafana queries its own managed storage where the integration has placed the data.
Summary reference
The following table compares the three core concepts at a glance.
For detailed documentation and how-to guides related to data sources, plugins, and integrations, refer to the following references:
Data sources:
Plugins:
Integrations:
For plugin developers:


