This is documentation for the next version of Grafana documentation. For the latest stable release, go to the latest version.
View alert state
An alert rule and its corresponding alert instances can transition through distinct states during the alert rule evaluation.

There are three key components that helps us understand the behavior of our alerts:
- Alert Instance State: Refers to the state of the individual alert instances.
- Alert Rule State: Determined by the “worst state” among its alert instances.
- Alert Rule Health: Indicates the status in cases of
ErrororNoDataevents.
View alert rule and instance states
To view the details of your alert rules and the status of alert instances:
Click Alerts & IRM -> Alerting.
Click Alert rules to view the list of existing alert rules.
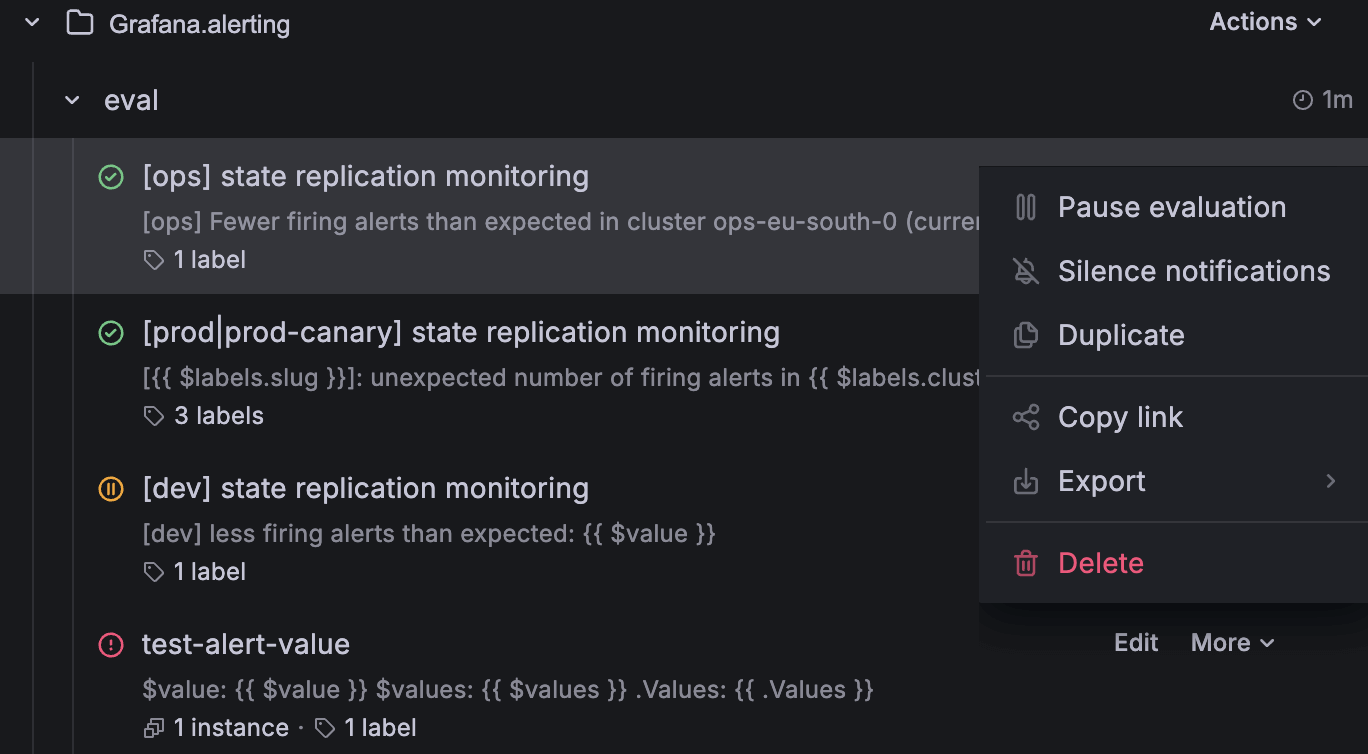
![View alert rule state and alert rule health in Grafana Alerting]()
Each alert rule shows its state, summary, and available actions such as Pause evaluation, Silence notifications, Export, Delete, and more.
Click on an alert rule to view additional details and its resulting alert instances.
View from the alert rule details page
To view more alert rule details, complete the following steps.
Click Alerts & IRM -> Alerting -> Alert rules.
Click to expand an alert rule.
Click the alert name to go to the alert details view.
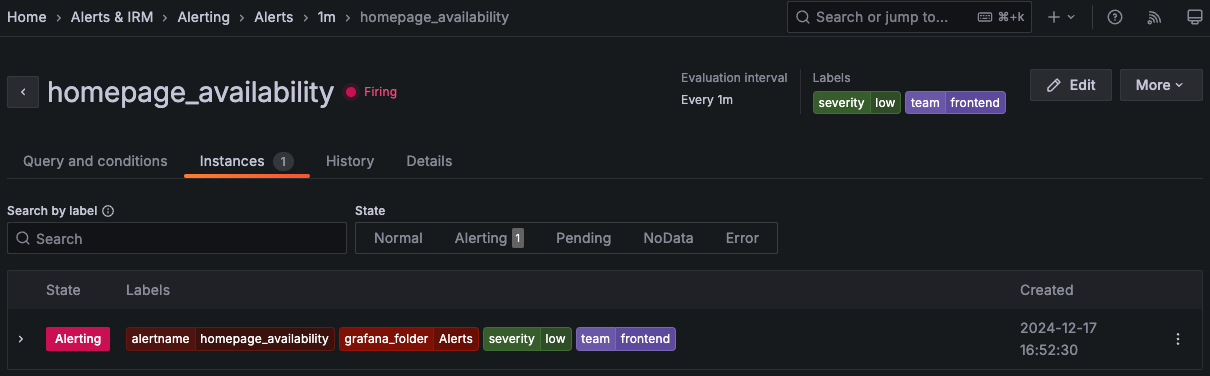
![Alert rule view page in Grafana Alerting]()
The namespace and group are shown in the breadcrumb navigation. They are interactive and can be used to filter rules by namespace or group.
The rest of the alert detail content is split up into tabs:
Query and conditions
View the details of the query that is used for the alert rule, including the expressions and intermediate values for each step of the expression pipeline. A graph view is included for range queries and data sources that return time series-like data frames.
Instances
Explore each alert instance, its status, labels and various other metadata for multi-dimensional alert rules.
Use Search by label to enter search criteria using label selectors. For example,
environment=production,region=~US|EU,severity!=warning.History
Explore the recorded history for an alert rule. You can also filter by alert state.
Details
Debug or audit using the alert rule metadata and view the alert rule annotations.
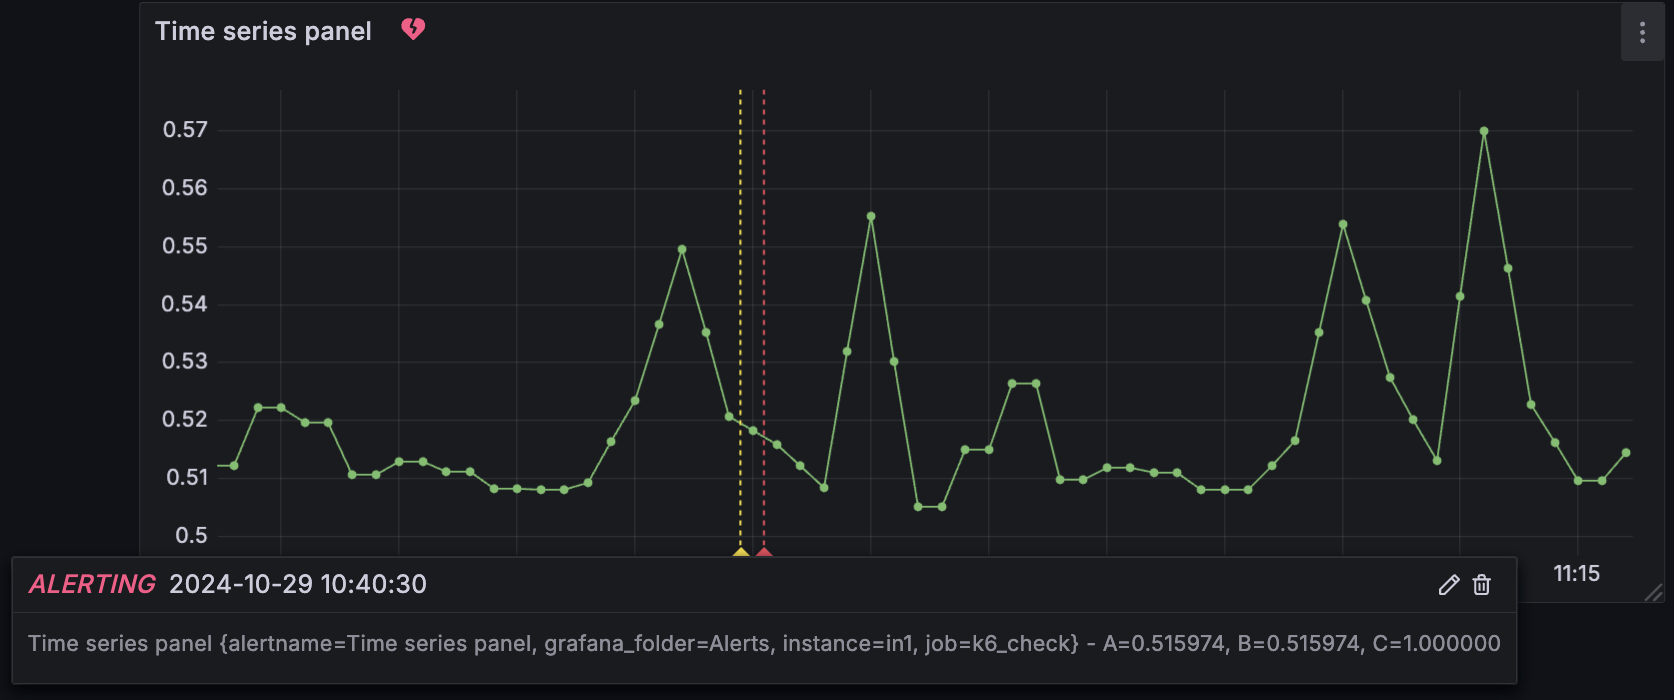
View alert state on panels
When an alert rule is linked to a time series panel, the time series panel displays the alert state and alert events.
A heart icon near the panel title shows the current alert state:
- A broken red heart when the alert is in
Alertingstate. - A green heart when the alert is in
Normalstate.
Colored annotations indicate changes in alert state, such as pending, alerting, and resolving.
Additionally, Grafana provides an alert list panel that you can add to a dashboard to display a list of alerts and their states.
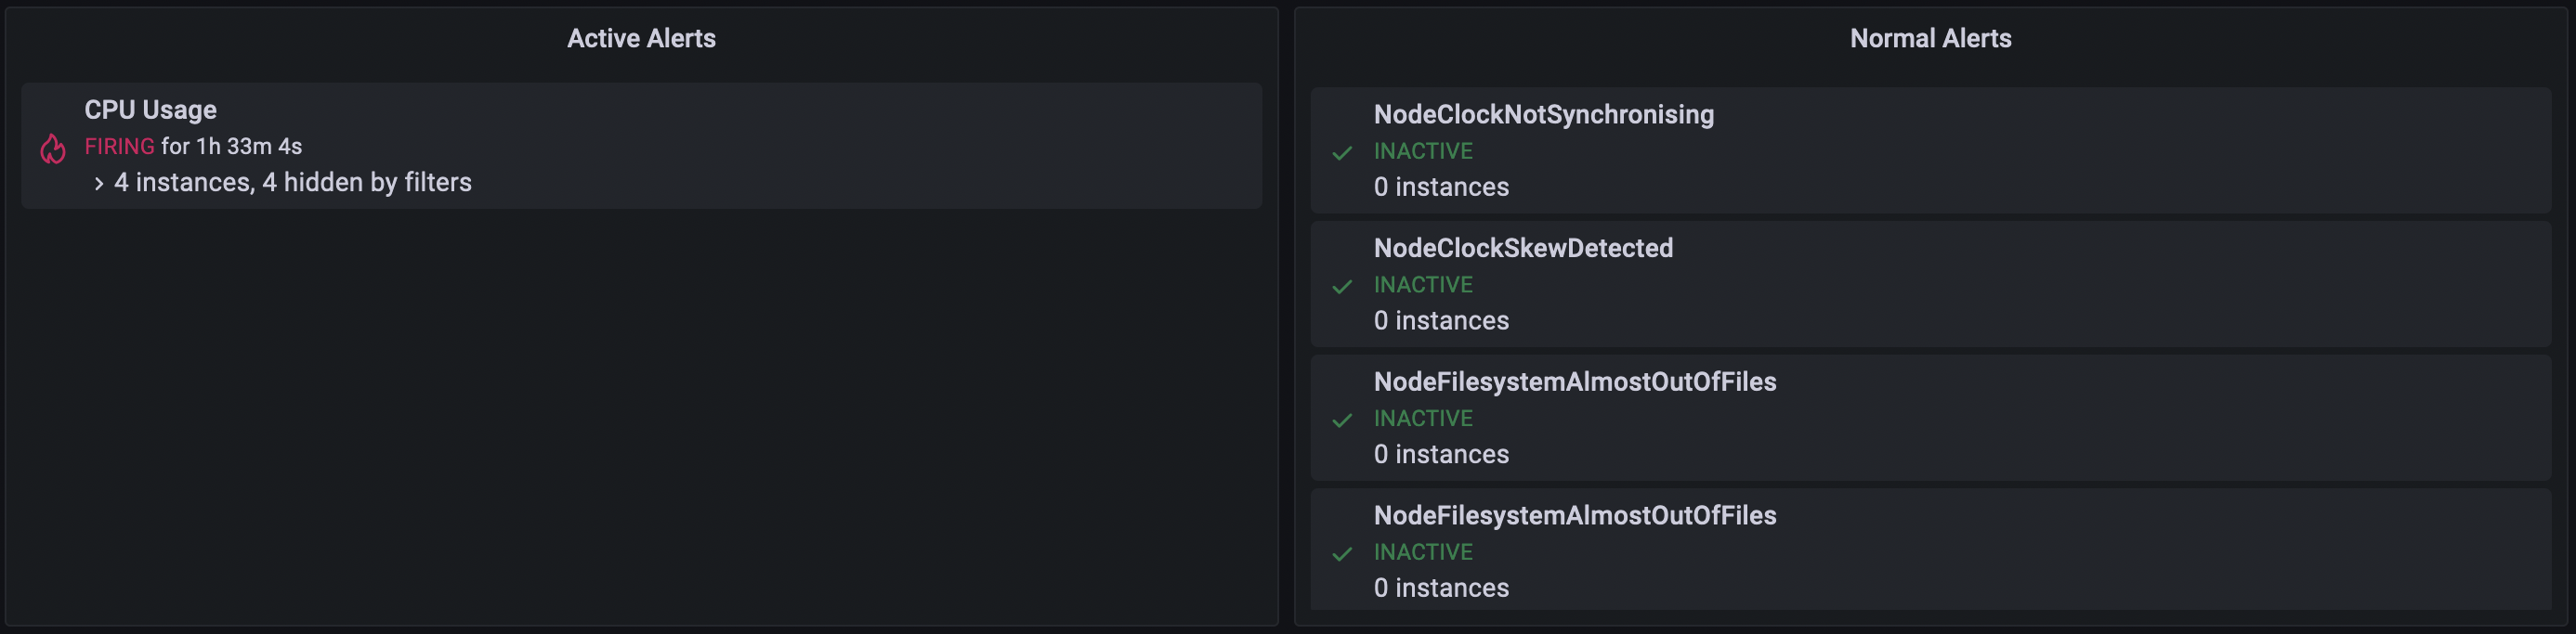
You can configure the alert list panel with various visualization options and filters to control how alerts are displayed. For more details, refer to the Alert list documentation.
With Grafana Play, you can explore and see how it works, learning from practical examples to accelerate your development. This feature can be seen on this demo dashboard with alert list panels and linked alert rules.


