What’s new in Grafana v7.2
This topic includes the release notes for the Grafana v7.2. For all details, read the full CHANGELOG.md.
The main highlights are:
- New date formatting options added
- Field options are out of beta!
- New transformations and enhancements
- Drag to reorder queries
- Inspect queries in Explore
- $__rate_interval for Prometheus
- Toggle parsed log fields
- Sensitive alert channel settings are now encrypted
- Grafana Enterprise features
- What’s new in other parts of the Grafana ecosystem
New date formatting options added
You can now customize how dates are formatted in Grafana. Custom date formats apply to the time range picker, graphs, and other panel visualizations.
This screenshot shows both a custom full date format with a 12 hour clock and am/pm suffix. The graph is also showing the same 12-hour clock format and a customized month and day format compared to the Grafana default MM/DD format.

Date formats are set for a Grafana instance by adjusting server-wide settings in the Grafana configuration file. We hope to add org- and user-level settings in the future.
[date_formats]
full_date = MMM Do, YYYY @ hh:mm:ss a
interval_second = hh:mm:ss a
interval_minute = hh:mm a
interval_hour = MMM DD hh:mm a
interval_day = MMM DD
interval_month = YYYY-MM
interval_year = YYYY
There is also experimental support to use the browser location and language to dynamically change the current date format for each user. This feature is disabled by default.
The Configuration topic has been updated as a result of this change.
Field options are out of beta!
After lots of testing and user feedback, we removed the beta label from the configuration options in the Field and Override tabs. This release also includes the following feature enhancements.
Added table column filters
You can now dynamically apply value filters to any table column. This option can be enabled for all columns or one specific column using an override rule.

Filter table columns has been added as a result of this feature.
New field override selection options
You can now add override rules that use a regex matcher to choose which fields to apply rules to.
New transformations and enhancements
Grafana 7.2 includes the following transformation enhancements:
- A new Group By transformation that allows you to group by multiple fields and add any number of aggregations for other fields.
- The Labels to fields transformation now allows you to pick one label and use that as the name of the value field.
- You can drag transformations to reorder them. Remember that transformations are processed in the order they are listed in the UI, so think before you move something!

Drag to reorder queries
The up and down arrows, which were previously the only way to change query order, have been removed. Instead, there is now a grab icon that allows you to drag and drop queries in a list to change their order.

The Queries topic has been updated as a result of this change.
Inspect queries in Explore
You can enjoy all the details query inspector gave you in dashboards now in Explore as well. You can open query inspector tab with the button next to query history. See Query inspector in Explore for more details.
$__rate_interval for Prometheus
You can now use the new variable $__rate_interval in Prometheus for rate functions mainly. $__rate_interval in general is one scrape interval larger than $__interval but is never smaller than four times the scrape interval (which is 15s by default). See the Prometheus data source for more details.
Toggle parsed log fields
With this awesome contribution from one of our community members, you can now toggle parsed fields in Explore if your logs are structured in json or logfmt.

The Toggle parsed fields section has been added to Explore as a result of this feature.
Sensitive alert channel settings are now encrypted
Alert notification channels now store sensitive settings and secrets, such as API tokens and passwords, encrypted in the database.
Grafana Enterprise features
These features are included in the Grafana Enterprise edition software.
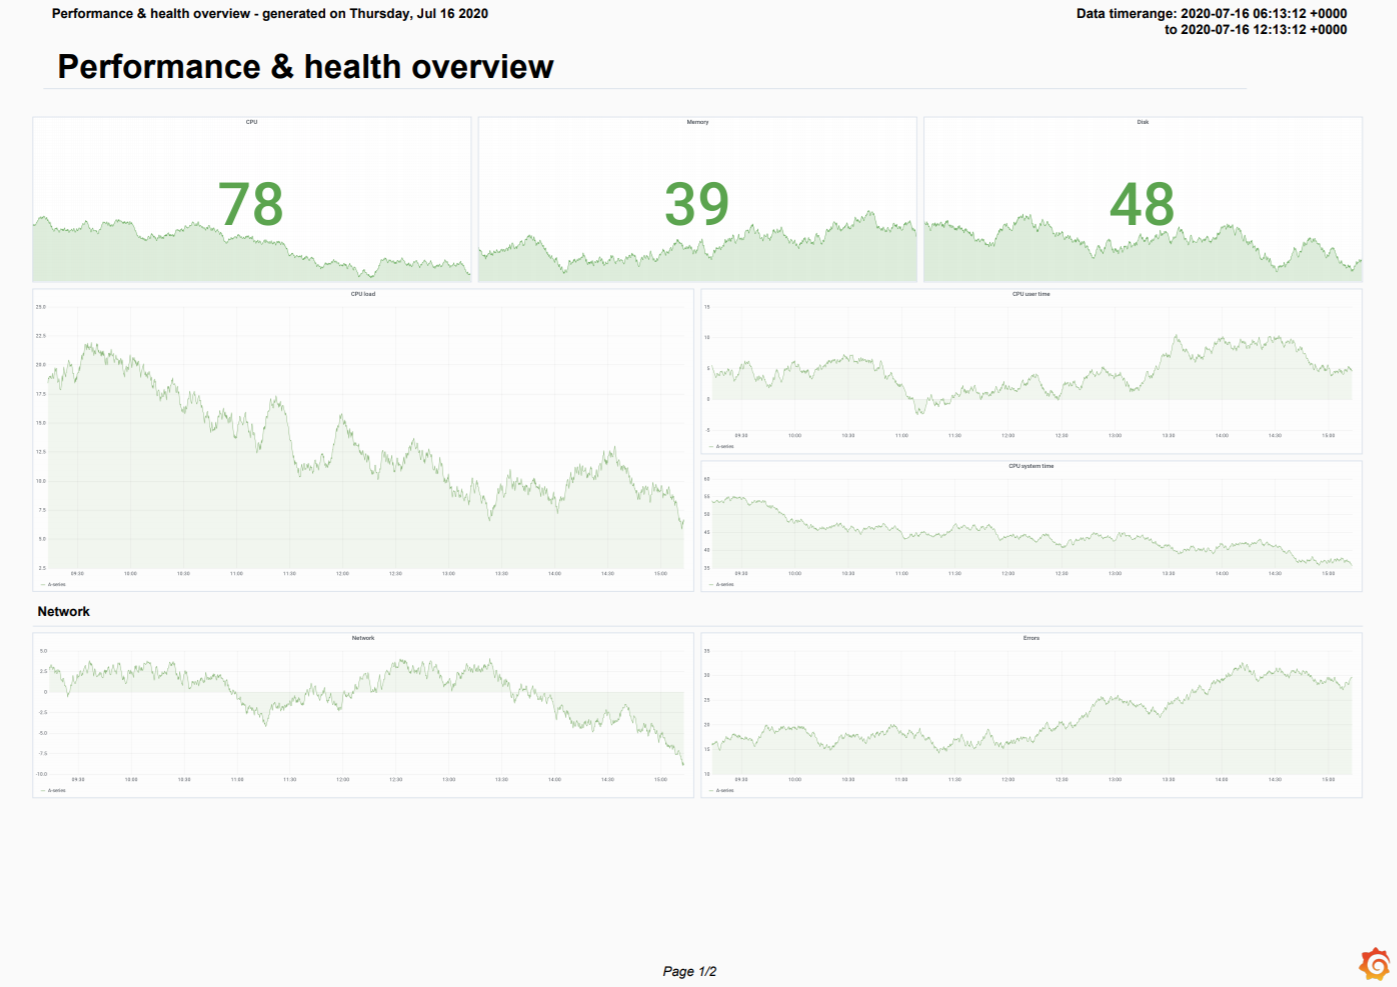
Report and export dashboards in grid layout
A new layout option is available when rendering reports: the grid layout. With this option, your report uses the panel layout from your dashboard, so that what you see is what you get. Learn more about the grid layout in the documentation.
The grid layout is also available for the Export dashboard as PDF feature.
Report time range
You can now generate a report with a different time range from the dashboard it is based on. This means that you no longer have to apply workarounds, such as copying dashboards or carefully aligning report generation with the end of the month, to generate reports that cover the period you want.
For more information, refer to Reports time range.
Organization-wide report settings
You can now configure organization-wide report settings, such as report branding, in the Settings tab on the Reporting page. Settings are applied to all the reports of your current organization.

For more information, refer to Report settings.
Changelog
Check out CHANGELOG.md for a complete list of new features, changes, and bug fixes.
What’s new in other parts of the Grafana ecosystem
ADX (Azure Data Explorer) plugin
In collaboration with Microsoft, we have improved the usability of our ADX datasource plugin by adding a visual query builder. The goal is to make it easier for users, regardless of their previous knowledge of writing KQL (Kusto Query Language) queries, to query and visualize their data.

X-Ray data source plugin
We are pleased to announce our very first version of our data source plugin for AWS X-Ray. You can use this plugin to visualize traces, look at analytics tables, and see insight summaries. For more information, refer to the X-Ray data source plugin page.


