What’s new in Grafana v11.1
Welcome to Grafana 11.1! This release contains some minor improvements following on the big announcements in Grafana 11.0. We’ve adding cell text wrapping to table visualizations, a much-requested feature. We’ve also redesigned the Alerting settings page and made it possible to manage access to Silences using role-based access control (RBAC). A number of accessibility improvements are included in this release, making Grafana easier to use for everyone. And lastly, the XY chart is now generally available.
For even more detail about all the changes in this release, refer to the changelog. For the specific steps we recommend when you upgrade to v11.1, check out our Upgrade Guide.
Dashboards and visualizations
Visualization ease of use improvements
We’ve made a number of small improvements to the data visualization experience in Grafana.
Table cell text wrapping
Available in public preview in all editions of Grafana
A longstanding feature request for the table visualization is to allow wrapping of text within cells. In Grafana 11.1 we’ve added this capability! By default, the column with the longest text is selected for wrapping. You can also configure wrapping manually using field overrides.
Learn more about the table panel in our table panel documentation.
Note
Text wrapping is in public preview, however, it’s available to use by default. We’d love hear from you about how this new feature is working. To provide feedback, you can open an issue in the Grafana GitHub repository.
Stat visualization percent change color mode options
Generally available in all editions of Grafana
Sometimes less is more! The Standard behavior for percent change in the stat visualization is to color positive percent changes green and negative percent changes red. Depending on your use case however, you may want to customize how percent change color is set. We’ve added the options to have percent change color mode Inverted (with positive red and negative green) or match the Same as value.
XY chart is GA
Generally available in all editions of Grafana
We’re promoting XY chart out of public preview and into general availability.
XY charts provide a way to visualize arbitrary x and y values in a graph so that you can easily show the relationship between two variables. XY charts are typically used to create scatter plots. You can also use them to create bubble charts where field values determine the size of each bubble:

Over the past several months we’ve introduced multiple enhancements to the visualizations like auto mode, which now handles most scenarios that previously required manual configuration. Additionally, we’ve added better control over point styling and further improved performance. We’re excited to include XY chart as a first class citizen in the core Grafana visualization library. To learn more about the panel, refer to the documentation.
To use the new XY chart visualization, you must first enable the autoMigrateXYChartPanel
feature toggle.
Alerting
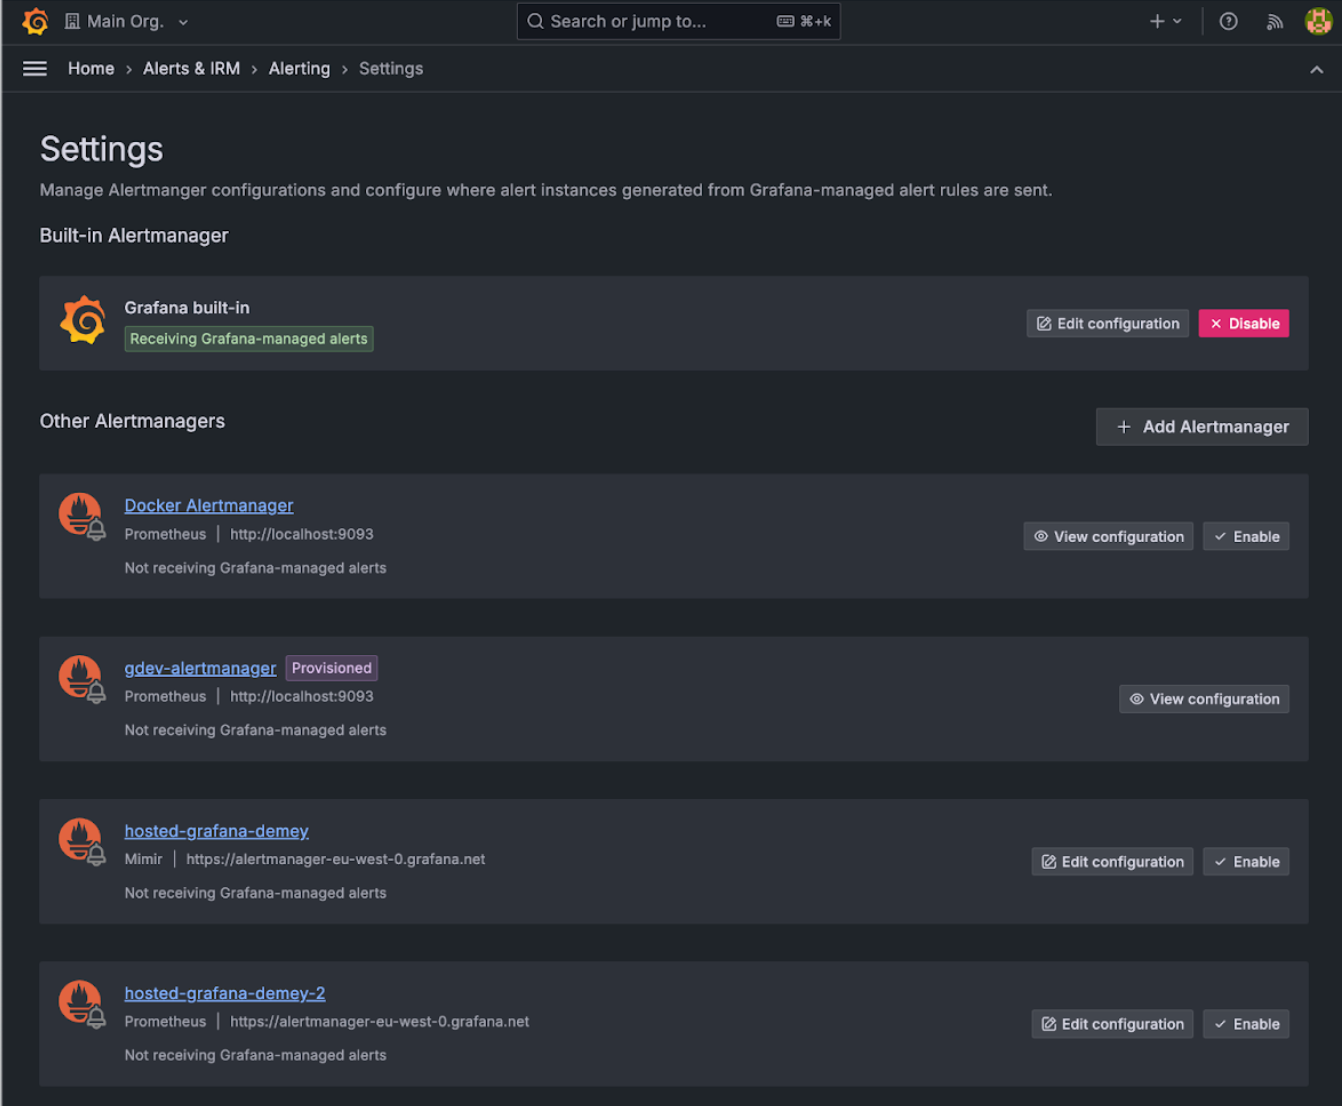
Re-designed settings page for Alerting
Generally available in all editions of Grafana
The new settings page provides you with a holistic view of where Grafana-managed alert instances are forwarded.
- Manage which Alertmanagers receive alert instances from Grafana-managed rules without navigating and editing data sources.
- Manage version snapshots for the built-in Alertmanager, which allows administrators to roll back unintentional changes or mistakes in the Alertmanager configuration.
- There is also a visual diff that compares the historical snapshot with the latest configuration to see which changes were made.
Learn more in the Alertmanager configuration documentation.
Alerting template selector
Generally available in all editions of Grafana
Enables you to easily choose which templates you want to use in your alert notification messages by adding a template selector in the Contact Points form.
Select from existing templates or enter a custom one for your specific needs. You can switch between the two tabs to access the list of available templates and copy them across to the customized version.
Learn more in the documentation.
Add OAuth2 to HTTP settings for vanilla Alertmanager / Mimir
Generally available in all editions of Grafana
Configure OAuth2 authentication for any Alertmanager or Mimir receiver (called Contact Points in Grafana) through the user interface. Learn more about alerting contact points in supported contact point integrations and find the reference for Oauth2 fields in the Prometheus Alertmanager docs for Oauth2.
Note that OAuth2 is not yet implemented for the Grafana built-in Alertmanager.
Improved paused alert visibility
Generally available in all editions of Grafana
Pause and resume alert rule evaluation directly from the Alert rules list and details view. This helps Improve visibility of when alert rules have been paused by displaying “Paused” as the alert rule state.
Learn more in the alert rules documentation.
Removes requirement of datasources:query permission for reading rules
Generally available in Grafana Enterprise and Cloud
Fetching a rule group no longer requires the datasources:query permission for every data source used by the rules within that group. Now, the only requirements are alert.rules:read and folders:read for the folder the group is contained in.
Note: datasources:query is still required to preview an alert rule, regardless of alert rules and folders permissions.
Learn more in the RBAC configuration documentation.
Rule-specific silences with permissions
Generally available in all editions of Grafana
More easily create silences directly from the Alert rule list view or detail page.
These rule-specific silences are guaranteed to only apply to a single rule and permissions to read, create, update or delete are tied to a user’s permissions for that rule.
Rule-specific silences with RBAC
Generally available in Grafana Enterprise and Cloud
Manage silences through Role-Based Access Control (RBAC). In addition to the Grafana open source functionality in Rule-specific silences with permissions, you can choose who can create, edit, and read silences using the following permissions:
- Users with the alert.silences:create permission, scoped within a folder, are able to create silences for rules contained within that folder and its subfolders
- Users with the alert.silences:read permission, scoped within a folder, are able to read silences for rules contained within that folder and its subfolders, and general silences
- Users with the alert.silences:write permission, scoped within a folder, are able to expire and recreate silences for rules contained within that folder and its subfolders
Learn more about managing access using roles.
Support for AWS SNS integration in Grafana-managed alerts
Generally available in all editions of Grafana
Send alerts notifications to AWS simple notifications service.
Recent accessibility improvements
Generally available in all editions of Grafana
GeoMap keyboard support
The GeoMap panel can now be used with a keyboard! Focus the map area, move around with the arrows keys and zoom in and out using + and -.
Panel shortcut keyboard support
We have panel shortcuts, which previously only worked on whichever panel you hovered over. It now also takes into account the keyboard focus.
Heading improvements
The majority of screen reader users find things on a web page using headings. Recently, we have added missing headings and corrected heading levels in some places, most notably panel titles.
Reduced motion support
Users who are affected by a lot of animations on a web site have the possibility to configure reduced motion settings. Grafana now supports this, either by making animations simpler or removing them altogether. We have implemented a rule, which prohibits unhandled transitions and animations, ensuring that we can continuously support reduced motion.


