
Time series

Time series visualizations are the default and primary way to visualize time series data as a graph. They can render series as lines, points, or bars. They’re versatile enough to display almost any time-series data. This public demo dashboard contains many different examples of how a time series visualization can be configured and styled.
Note
You can migrate from the old Graph visualization to the new time series visualization. To migrate, open the panel and click the Migrate button in the side pane.
The following video guides you through the creation steps and common customizations of time series visualizations and is great for beginners:
Tooltip options
Tooltip options control the information overlay that appears when you hover over data points in the graph.
Tooltip mode
When you hover your cursor over the visualization, Grafana can display tooltips. Choose how tooltips behave.
- Single - The hover tooltip shows only a single series, the one that you are hovering over on the visualization.
- All - The hover tooltip shows all series in the visualization. Grafana highlights the series that you are hovering over in bold in the series list in the tooltip.
- Hidden - Do not display the tooltip when you interact with the visualization.
Use an override to hide individual series from the tooltip.
Hover proximity
This option controls how close your cursor must be to a data point before the tooltip appears. Values are in pixels.
Legend options
Legend options control the series names and statistics that appear under or to the right of the graph.
Legend mode
Use these settings to define how the legend appears in your visualization. For more information about the legend, refer to Configure a legend.
- List - Displays the legend as a list. This is a default display mode of the legend.
- Table - Displays the legend as a table.
- Hidden - Hides the legend.
Legend placement
Choose where to display the legend.
- Bottom - Below the graph.
- Right - To the right of the graph.
Legend values
Choose which of the standard calculations to show in the legend. You can have more than one.
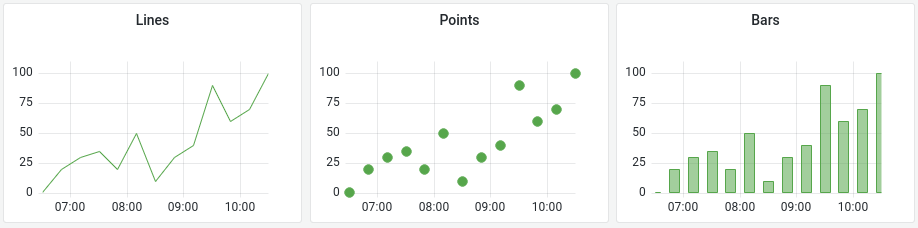
Graph styles
Use this option to define how to display your time series data. You can use overrides to combine multiple styles in the same graph.
- Lines
- Bars
- Points
Bar alignment
Set the position of the bar relative to a data point. In the examples below, Show points is set to Always which makes it easier to see the difference this setting makes. The points do not change; the bars change in relationship to the points.
- Before
![Bar alignment before icon]() The bar is drawn before the point. The point is placed on the trailing corner of the bar.
The bar is drawn before the point. The point is placed on the trailing corner of the bar. - Center
![Bar alignment center icon]() The bar is drawn around the point. The point is placed in the center of the bar. This is the default.
The bar is drawn around the point. The point is placed in the center of the bar. This is the default. - After
![Bar alignment after icon]() The bar is drawn after the point. The point is placed on the leading corner of the bar.
The bar is drawn after the point. The point is placed on the leading corner of the bar.
 The bar is drawn before the point. The point is placed on the trailing corner of the bar.
 The bar is drawn around the point. The point is placed in the center of the bar. This is the default.
 The bar is drawn after the point. The point is placed on the leading corner of the bar.
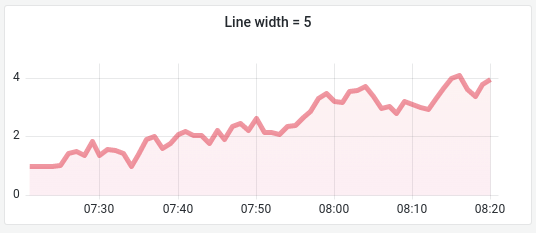
Line width
Line width is a slider that controls the thickness for series lines or the outline for bars.
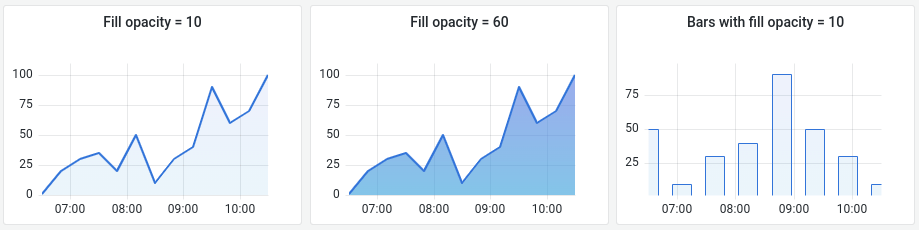
Fill opacity
Use opacity to specify the series area fill color.
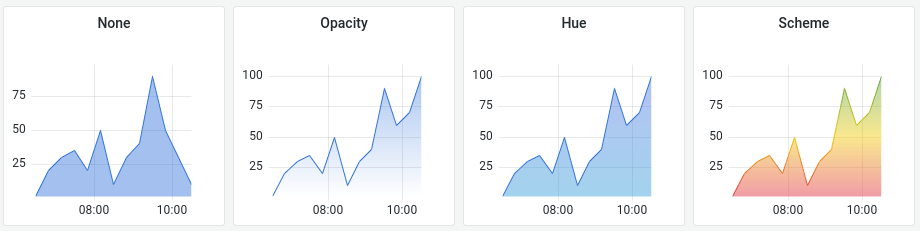
Gradient mode
Gradient mode specifies the gradient fill, which is based on the series color. To change the color, use the standard color scheme field option. For more information, refer to Color scheme.
- None: No gradient fill. This is the default setting.
- Opacity: An opacity gradient where the opacity of the fill increases as y-axis values increase.
- Hue: A subtle gradient that is based on the hue of the series color.
- Scheme: A color gradient defined by your Color scheme. This setting is used for the fill area and line. For more information about scheme, refer to Scheme gradient mode.
Gradient appearance is influenced by the Fill opacity setting. The following image show, the Fill opacity is set to 50.
Show points
You can configure your visualization to add points to lines or bars.
- Auto: Grafana determines to show or not to show points based on the density of the data. If the density is low, then points appear.
- Always: Show the points regardless of how dense the data set is.
- Never: Do not show points.
Point size
Set the size of the points, from 1 to 40 pixels in diameter.
Line interpolation
This option controls how the graph interpolates the series line.
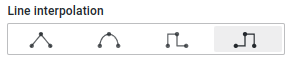
- Linear: Points are joined by straight lines.
- Smooth: Points are joined by curved lines that smooths transitions between points.
- Step before: The line is displayed as steps between points. Points are rendered at the end of the step.
- Step after: The line is displayed as steps between points. Points are rendered at the beginning of the step.
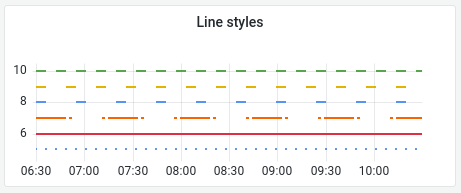
Line style
Set the style of the line. To change the color, use the standard color scheme field option.
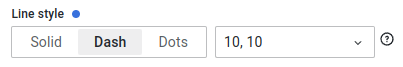
- Solid: Display a solid line. This is the default setting.
- Dash: Display a dashed line. When you choose this option, a list appears for you to select the length and gap (length, gap) for the line dashes. Dash spacing set to 10, 10 (default).
- Dots: Display dotted lines. When you choose this option, a list appears for you to select the gap (length = 0, gap) for the dot spacing. Dot spacing set to 0, 10 (default)
Connect null values
Choose how null values, which are gaps in the data, appear on the graph. Null values can be connected to form a continuous line or set to a threshold above which gaps in the data are no longer connected.
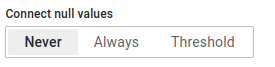
- Never: Time series data points with gaps in the data are never connected.
- Always: Time series data points with gaps in the data are always connected.
- Threshold: Specify a threshold above which gaps in the data are no longer connected. This can be useful when the connected gaps in the data are of a known size and/or within a known range, and gaps outside this range should no longer be connected.
Disconnect values
Choose whether to set a threshold above which values in the data should be disconnected.

- Never: Time series data points in the data are never disconnected.
- Threshold: Specify a threshold above which values in the data are disconnected. This can be useful when desired values in the data are of a known size and/or within a known range, and values outside this range should no longer be connected.
Stack series
Stacking allows Grafana to display series on top of each other. Be cautious when using stacking in the visualization as it can easily create misleading graphs. To read more about why stacking might not be the best approach, refer to The issue with stacking.
- Off: Turns off series stacking. When Off, all series share the same space in the visualization.
- Normal: Stacks series on top of each other.
- 100%: Stack by percentage where all series add up to 100%.
Stack series in groups
The stacking group option is only available as an override. For more information about creating an override, refer to Configure field overrides.
Edit the panel and click Overrides.
Create a field override for the Stack series option.
In stacking mode, click Normal.
Name the stacking group in which you want the series to appear.
The stacking group name option is only available when you create an override.
Fill below to
The Fill below to option fills the area between two series. This option is only available as a series/field override.
- Edit the panel and click Overrides.
- Select the fields to fill below.
- In Add override property, select Fill below to.
- Select the series for which you want the fill to stop.
The following example shows three series: Min, Max, and Value. The Min and Max series have Line width set to 0. Max has a Fill below to override set to Min, which fills the area between Max and Min with the Max line color.

Axis options
Options under the axis category change how the x- and y-axes are rendered. Some options do not take effect until you click outside of the field option box you are editing. You can also or press Enter.
Time zone
Set the desired time zone(s) to display along the x-axis.
Placement
Select the placement of the y-axis.
- Auto: Automatically assigns the y-axis to the series. When there are two or more series with different units, Grafana assigns the left axis to the first unit and the right axis to the units that follow.
- Left: Display all y-axes on the left side.
- Right: Display all y-axes on the right side.
- Hidden: Hide all axes.
To selectively hide axes, Add a field override that targets specific fields.
Label
Set a y-axis text label. If you have more than one y-axis, then you can assign different labels using an override.
Width
Set a fixed width of the axis. By default, Grafana dynamically calculates the width of an axis.
By setting the width of the axis, data with different axes types can share the same display proportions. This setting makes it easier for you to compare more than one graph’s worth of data because the axes are not shifted or stretched within visual proximity to each other.
Show grid lines
Set the axis grid line visibility.
- Auto: Automatically show grid lines based on the density of the data.
- On: Always show grid lines.
- Off: Never show grid lines.
Color
Set the color of the axis.
- Text: Set the color based on theme text color.
- Series: Set the color based on the series color.
Show border
Set the axis border visibility.
Scale
Set the y-axis values scale.
- Linear: Divides the scale into equal parts.
- Logarithmic: Use a logarithmic scale. When you select this option, a list appears for you to choose a binary (base 2) or common (base 10) logarithmic scale.
- Symlog: Use a symmetrical logarithmic scale. When you select this option, a list appears for you to choose a binary (base 2) or common (base 10) logarithmic scale. The linear threshold option allows you to set the threshold at which the scale changes from linear to logarithmic.
Centered zero
Set the y-axis to be centered on zero.
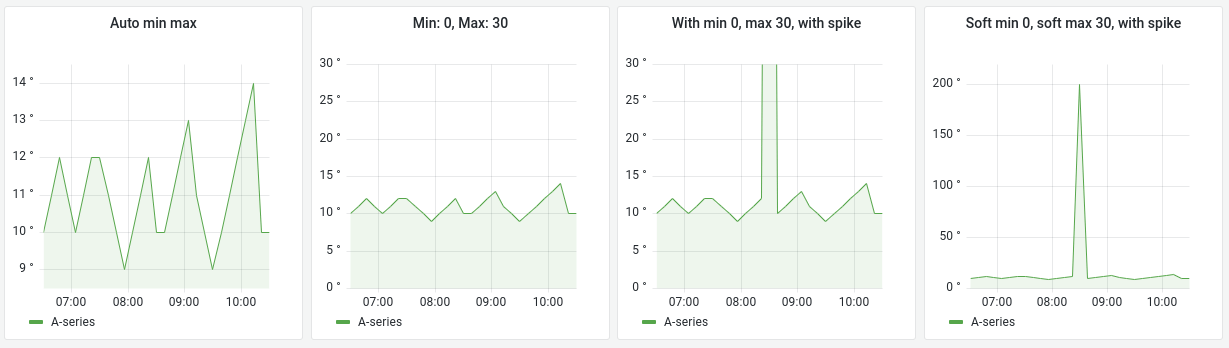
Soft min and soft max
Set a Soft min or soft max option for better control of y-axis limits. By default, Grafana sets the range for the y-axis automatically based on the dataset.
Soft min and soft max settings can prevent small variations in the data from being magnified when it’s mostly flat. In contrast, hard min and max values help prevent obscuring useful detail in the data by clipping intermittent spikes past a specific point.
To define hard limits of the y-axis, set standard min/max options. For more information, refer to Configure standard options.
Transform
Use this option to transform the series values without affecting the values shown in the tooltip, context menu, or legend.
- Negative Y transform: Flip the results to negative values on the Y axis.
- Constant: Show the first value as a constant line.
Note
The transform option is only available as an override.
Display multiple y-axes
In some cases, you may want to display multiple y-axes. For example, if you have a dataset showing both temperature and humidity over time, you may want to show two y-axes with different units for these two series.
You can do this by adding field overrides. Follow the steps as many times as required to add as many y-axes as you need.
Color options
By default, the graph uses the standard Color scheme option to assign series colors. You can also use the legend to open the color picker by clicking the legend series color icon. Setting color this way automatically creates an override rule that set’s a specific color for a specific series.
Classic palette
The most common setup is to use the Classic palette for graphs. This scheme automatically assigns a color for each field or series based on its order. If the order of a field changes in your query, the color also changes. You can manually configure a color for a specific field using an override rule.
Single color
Use this mode to specify a color. You can also click the colored line icon next to each series in the Legend to open the color picker. This automatically creates a new override that sets the color scheme to single color and the selected color.
By value color schemes
If you select a by value color scheme like From thresholds (by value) or Green-Yellow-Red (by value), the Color series by option appears. This option controls which value (Last, Min, Max) to use to assign the series its color.
Scheme gradient mode
The Gradient mode option located under the Graph styles has a mode named Scheme. When you enable Scheme, the line or bar receives a gradient color defined from the selected Color scheme.
From thresholds
If the Color scheme is set to From thresholds (by value) and Gradient mode is set to Scheme, then the line or bar color changes as they cross the defined thresholds.

The following image shows bars mode enabled.

Gradient color schemes
The following image shows a line chart with the Green-Yellow-Red (by value) color scheme option selected.

The following image shows a bar chart with the Green-Yellow-Red (by value) color scheme option selected.

Was this page helpful?
Related resources from Grafana Labs


