

Get started with Grafana Logs Drilldown
The best way to see what Grafana Logs Drilldown can do for you is to use it to explore your own log data. If you have a Grafana Cloud account, you can access Logs Drilldown by selecting Drilldown > Logs, or you can install Logs Drilldown in your own Grafana instance.
Guided tour
While you are browsing your log data in Logs Drilldown, watch for any unexpected spikes in your logs. Or perhaps one of your services is down and has stopped logging. Maybe you’re seeing an increase in errors after a recent release.
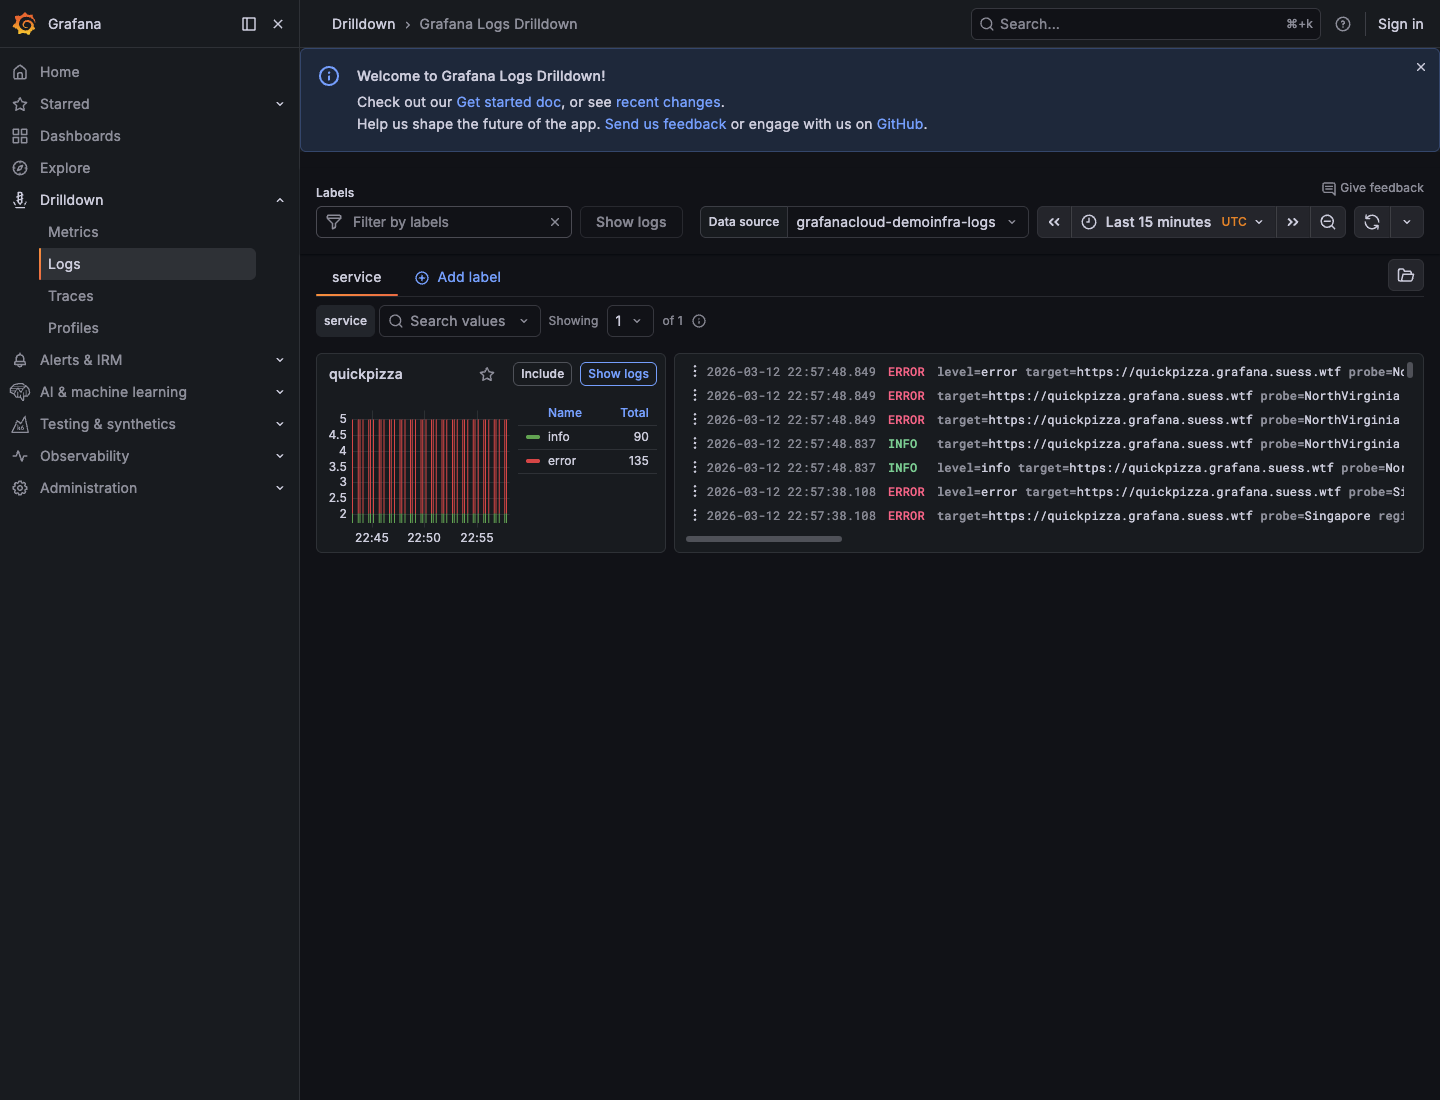
To take a tour of Logs Drilldown, follow these steps:
Open your Grafana stack in a web browser.
From the Grafana main menu, select Drilldown > Logs. This opens the Overview page showing time series and log visualizations for all services in your selected Loki instance. (No services?)
If you have multiple Loki data sources, you can change your Data source from the menu in the top toolbar. Logs Drilldown only supports Loki data sources.
Select a recent time range. You can modify your time range in two ways:
- With the standard time range picker on the top right.
- By clicking and dragging the time range on any time series visualization.
Services are shown based on log volume. You can use the service search field to find a service by name.
Each service panel shows a preview of recent log lines. Click a log line to open its menu, where you can:
- Show context: View the log line in the context of the logs that occurred before and after it.
- Go to log line: Open the service details page focused on that specific log line.
- Show similar logs: Open the service details page filtered to log lines like the one you selected.
You can also click a value in a preview log line to add it as a line filter and open the service details page with that filter applied.
If you want to view services by label instead of by service name, click (+) Add label and either select a label from the menu or search for a label.
Tip
Administrators can configure default fields to display in log visualizations. Refer to Configure Logs Drilldown for details.
Tip
Administrators can configure which labels appear by default on the landing page. Refer to Configure Logs Drilldown for details.
To explore logs for a service, click Show logs on the service panel. Grafana opens the service details page on the Logs tab.
On the Logs tab, you can:
- Use the log controls (which can be expanded using the expand/collapse button on the right) to adjust sort order, filter by string or level, change display options, and more. For details, refer to View logs.
- Click individual log lines to view detailed information including fields and links in the Log Details panel.
- Scroll to the bottom to load more log entries with infinite scroll.
- Use line wrapping controls to adapt the log display for easier reading, choosing between disabled, enabled, and enabled with JSON formatting.
On the service details page, click the Labels tab to see visualizations of log volume for each label. (No labels?)
On the Labels tab, to select a label to see the log volume for each value of that label, click the Select button. Logs Drilldown shows you the volume of logs with specific labels and fields. Refer to Labels and Fields.
Select the Fields tab to see visualizations of log volume for each field. To drill down into details the same way as labels, click Select for a field.
Click the Patterns tab to see log volume for each automatically detected pattern. Log patterns let you work with groups of similar log lines. You can hide log patterns that are noisy, or focus only on the patterns that are most useful. Refer to Log Patterns.
Click the Logs tab. Click the menu icon (three vertical dots) on either panel to open the panel menu, then select Explore. Grafana displays the Explore page, with a query based on the selections you made in Logs Drilldown. The panel menu also includes options such as Add to Dashboard and Create alert. For details, refer to View logs.
Further resources
- Watch: How to Use the Logs Drilldown App for Grafana
- Watch: All About Logs Drilldown for Grafana Loki (Loki Community Call October 2024)
Was this page helpful?
Related resources from Grafana Labs



