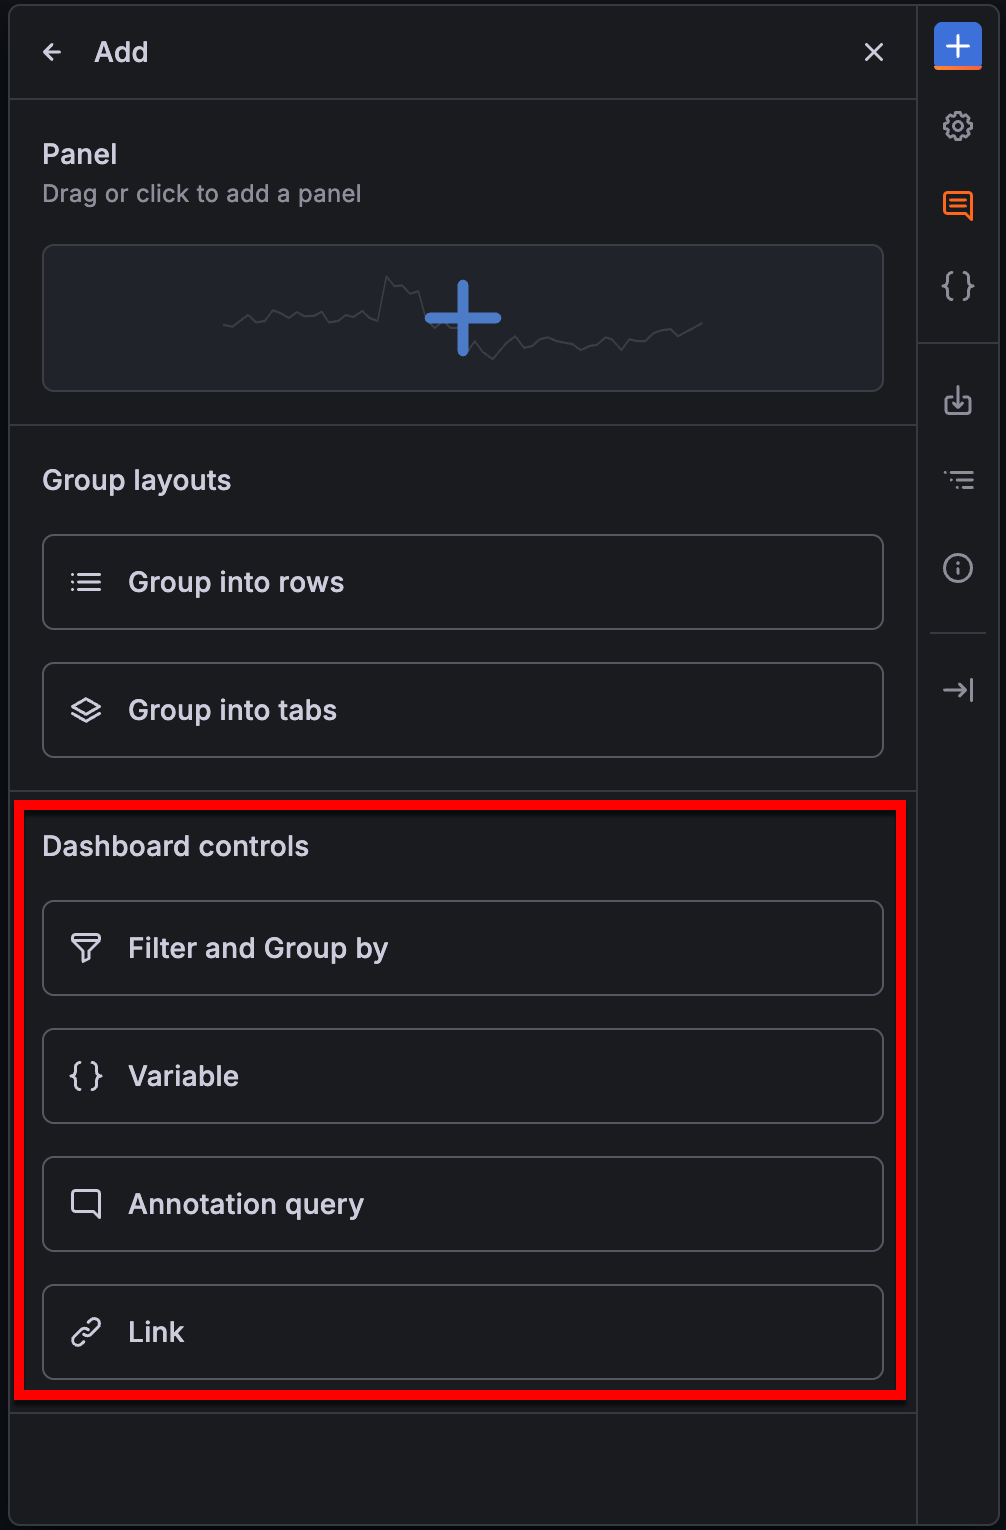
Dashboard controls
In the Dashboard controls section of the sidebar, you can add variables, annotation queries, dashboard links, and controls to filter and group data, without leaving the dashboard.
Add filters and group by controls
Note
The Filter and Group by feature renames the Ad hoc filters variable and extends it by adding grouping for Prometheus and Loki data sources. However, in the dashboard schema, it’s still referred to as
"kind": "AdhocVariable"under thevariablesschema property.
To add filters and group by controls, follow these steps:
Navigate to the dashboard you want to update.
Click Edit.
Click the Add new element icon (blue plus sign).
Click Filter and Group by.
Enter a Name for the filter.
(Optional) In the Label field, enter the display name for the filter drop-down list.
If you don’t enter a display name, then the drop-down list label is the filter name.
(Optional) In the Description field, enter a description of the filter. The description appears as an info icon tooltip next to the filter name on the dashboard.
Descriptions support links. You can use Markdown-style links (
[link text](https://example.com)) or paste bare URLs (https://example.com). OnlyhttpandhttpsURLs are rendered as clickable links—other protocols are displayed as plain text.Choose a Display option:
- Above dashboard: The filter drop-down list displays above the dashboard with the filter Name or Label value. This is the default.
- Above dashboard, label hidden: The filter drop-down list displays above the dashboard, but without showing the name of the filter.
- Controls menu: The filter is displayed in the dashboard controls menu instead of above the dashboard. The dashboard controls menu appears as a button in the dashboard toolbar.
- Hidden: No filter drop-down list is displayed on the dashboard.
Under the Filter options section of the page, set the following options:
Click Save.
Enter an optional description of your dashboard changes, and then click Save.
Click Exit edit.
For more detailed information on the Filter and Group by option, refer to the full Filter and group by controls documentation.
Add variables
To add a variable, follow these steps:
Navigate to the dashboard you want to update.
Click Edit.
Click + Add variable at the top of the dashboard or click the Add new element icon (blue plus sign) and select Variable.
Choose a variable type from the list.
You can update the variable type by clicking Change type in the sidebar.
Enter a Name for the variable.
(Optional) In the Label field, enter the display name for the variable drop-down list.
If you don’t enter a display name, then the drop-down list label is the variable name.
(Optional) In the Description field, enter a description of the variable. The description appears as an info icon tooltip next to the variable name on the dashboard.
Descriptions support links. You can use Markdown-style links (
[link text](https://example.com)) or paste bare URLs (https://example.com). OnlyhttpandhttpsURLs are rendered as clickable links—other protocols are displayed as plain text.Choose a Display option:
- Above dashboard - The variable drop-down list displays above the dashboard with the variable Name or Label value. This is the default.
- Above dashboard, label hidden - The variable drop-down list displays above the dashboard, but without showing the name of the variable.
- Controls menu - The variable is displayed in the dashboard controls menu instead of above the dashboard. The dashboard controls menu appears as a button in the dashboard toolbar.
- Hidden - No variable drop-down list is displayed on the dashboard.
- Complete the variable configuration. For more detailed configuration information, click the one of the following links to complete the steps for adding your selected variable type:
- Click Save.
- (Optional) Enter a description of the changes you’ve made.
- Click Save.
- Click Exit edit.
For more detailed information on variables, refer to the full Variables documentation.
Add annotation queries
To add an annotation query, follow these steps:
Navigate to the dashboard you want to update.
Click Edit.
Click the Add new element icon (blue plus sign).
Click Annotation query.
Enter a name for the annotation query.
This name is given to the toggle that allows you to enable/disable showing annotation events from this query.
If you don’t want to use the annotation query right away, clear the Enabled checkbox.
Select a color for the event markers.
Select one of the following options in the Show annotation controls in drop-down list to control where annotations are displayed:
- Above dashboard - The annotation toggle is displayed above the dashboard. This is the default.
- Controls menu - The annotation toggle is displayed in the dashboard controls menu instead of above the dashboard. The dashboard controls menu appears as a button in the dashboard toolbar.
- Hidden - The annotation toggle is not displayed on the dashboard.
In the Show in drop-down, choose one of the following options:
- All panels - The annotations are displayed on all panels that support annotations.
- Selected panels - The annotations are displayed on all the panels you select.
- All panels except - The annotations are displayed on all panels except the ones you select.

Annotation filtering - To add a query, do one of the following:
- Click Open query editor to open Annotation Query dialog box and write or construct a query. The annotation query options are different for each data source. For information about annotations in a specific data source, refer to the specific data source topic.
- Click Use saved query to open a the Saved queries drawer and select a saved query.
- (Optional) Click Test annotation query to ensure that the query is working properly.
- Click Close when you’ve completed the query setup.
- Click Save.
- (Optional) Enter a description of the changes you’ve made.
- Click Save.
- Click Exit edit.

Note
Saved queries is currently in public preview in Grafana Enterprise and Grafana Cloud only.
For more detailed information about annotations, refer to the full Annotations documentation.
Add links
For more detailed information on dashboard links, refer to the full Dashboard links documentation.
Add links to dashboards
To add a link to another dashboard at the top of your current dashboard, follow these steps:
- Navigate to the dashboard you want to update.
- Click Edit.
- Click the Add new element icon (blue plus sign).
- Click Link.
In the With tags drop-down list, enter tags to limit the linked dashboards to only the ones with the tags you enter.
If you don’t add any tags, Grafana includes links to all other dashboards.
Set link options:
- Show as dropdown – If you are linking to lots of dashboards, then you probably want to select this option and add an optional title to the dropdown. Otherwise, Grafana displays the dashboard links side by side across the top of your dashboard.
- Include current time range – Select this option to include the dashboard time range in the link. When the user clicks the link, the linked dashboard opens with the indicated time range already set. Example: https://play.grafana.org/d/000000010/annotations?orgId=1&from=now-3h&to=now
- Include current template variable values – Select this option to include template variables currently used as query parameters in the link. When the user clicks the link, any matching templates in the linked dashboard are set to the values from the link. For more information, see Dashboard URL variables.
- Open link in new tab – Select this option if you want the dashboard link to open in a new tab or window.
- Show in controls menu – Select this option to display the link in the dashboard controls menu instead of at the top of the dashboard. The dashboard controls menu appears as a button in the dashboard toolbar.
- Click Save.
- (Optional) Enter a description of the changes you’ve made.
- Click Save.
- Click Exit edit.
The default link type is Dashboards.
Add a URL link to a dashboard
Add a link to a URL at the top of your current dashboard. You can link to any available URL, including dashboards, panels, or external sites. You can even control the time range to ensure the user is zoomed in on the right data in Grafana.
To add a URL link to your dashboard, follow these steps:
- Navigate to the dashboard you want to update.
- Click Edit.
- Click the Add new element icon (blue plus sign).
- Click Link.
In the Type drop-down list, select Link.
In the URL field, enter the URL to which you want to link.
Depending on the target, you might want to include field values. Example: https://github.com/grafana/grafana/issues/new?title=Dashboard%3A%20HTTP%20Requests
In the Tooltip field, enter the tooltip you want the link to display when the user hovers their mouse over it.
In the Icon drop-down, choose the icon you want displayed with the link.
Set link options; by default, these options are enabled for URL links:
- Include current time range – Select this option to include the dashboard time range in the link. When the user clicks the link, the linked dashboard opens with the indicated time range already set. Example: https://play.grafana.org/d/000000010/annotations?orgId=1&from=now-3h&to=now
- Include current template variable values – Select this option to include template variables currently used as query parameters in the link. When the user clicks the link, any matching templates in the linked dashboard are set to the values from the link.
- Open link in new tab – Select this option if you want the dashboard link to open in a new tab or window.
- Show in controls menu – Select this option to display the link in the dashboard controls menu instead of at the top of the dashboard. The dashboard controls menu appears as a button in the dashboard header.
- Click Save.
- (Optional) Enter a description of the changes you’ve made.
- Click Save.
- Click Exit edit.
Manage dashboard controls
After you add dashboard controls, you can manage them from the dashboard options. In this view, the sidebar includes collapsible sections for filters, variables, annotations, and links, including hidden controls that aren’t otherwise visible on the dashboard:
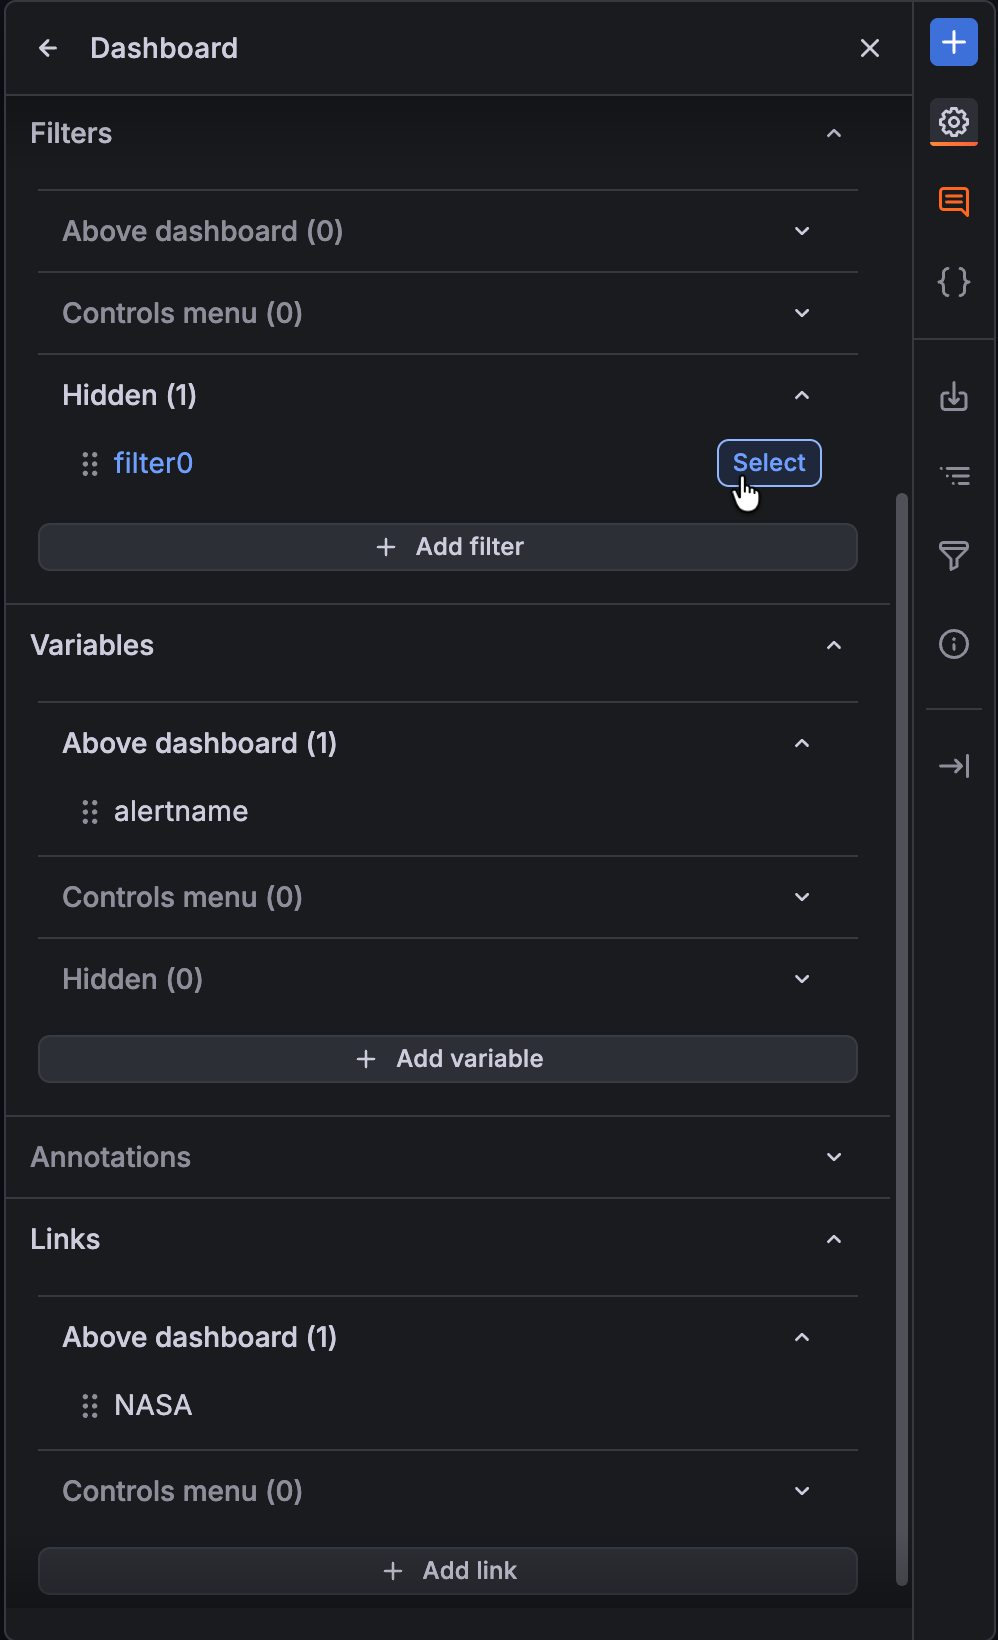
To manage dashboard controls, follow these steps:
Click the Dashboard options icon in the sidebar.
In the sidebar, expand the appropriate collapsible section.
Do one or more of the following:
- Edit: Click Select on the control to open it in the sidebar so you can make updates.
- Reorder: Drag and drop controls to reorder them.
- Change display: Drag and drop controls between sub-sections Above dashboard, Controls menu, and Hidden to update the control display option. Note that links can’t be hidden.
Tip
To get back to controls management from configuration, click the Dashboard options icon.
Make any other changes as needed.
Click Save.
(Optional) Enter a description of the changes you’ve made.
Click Save.
Click Exit edit.


