Variables
Note: Looking for prebuilt Grafana dashboards? Check out our full library of dashboards and more →
A variable is a placeholder for a value that you can use in dashboard queries, panel titles, links, and other dashboard elements. When you change the value of a variable, Grafana updates every dashboard element that uses that variable.
Variables are displayed as drop-down lists (or in some cases text fields) at the top of the dashboard. These controls let viewers change what the dashboard displays without editing the dashboard.
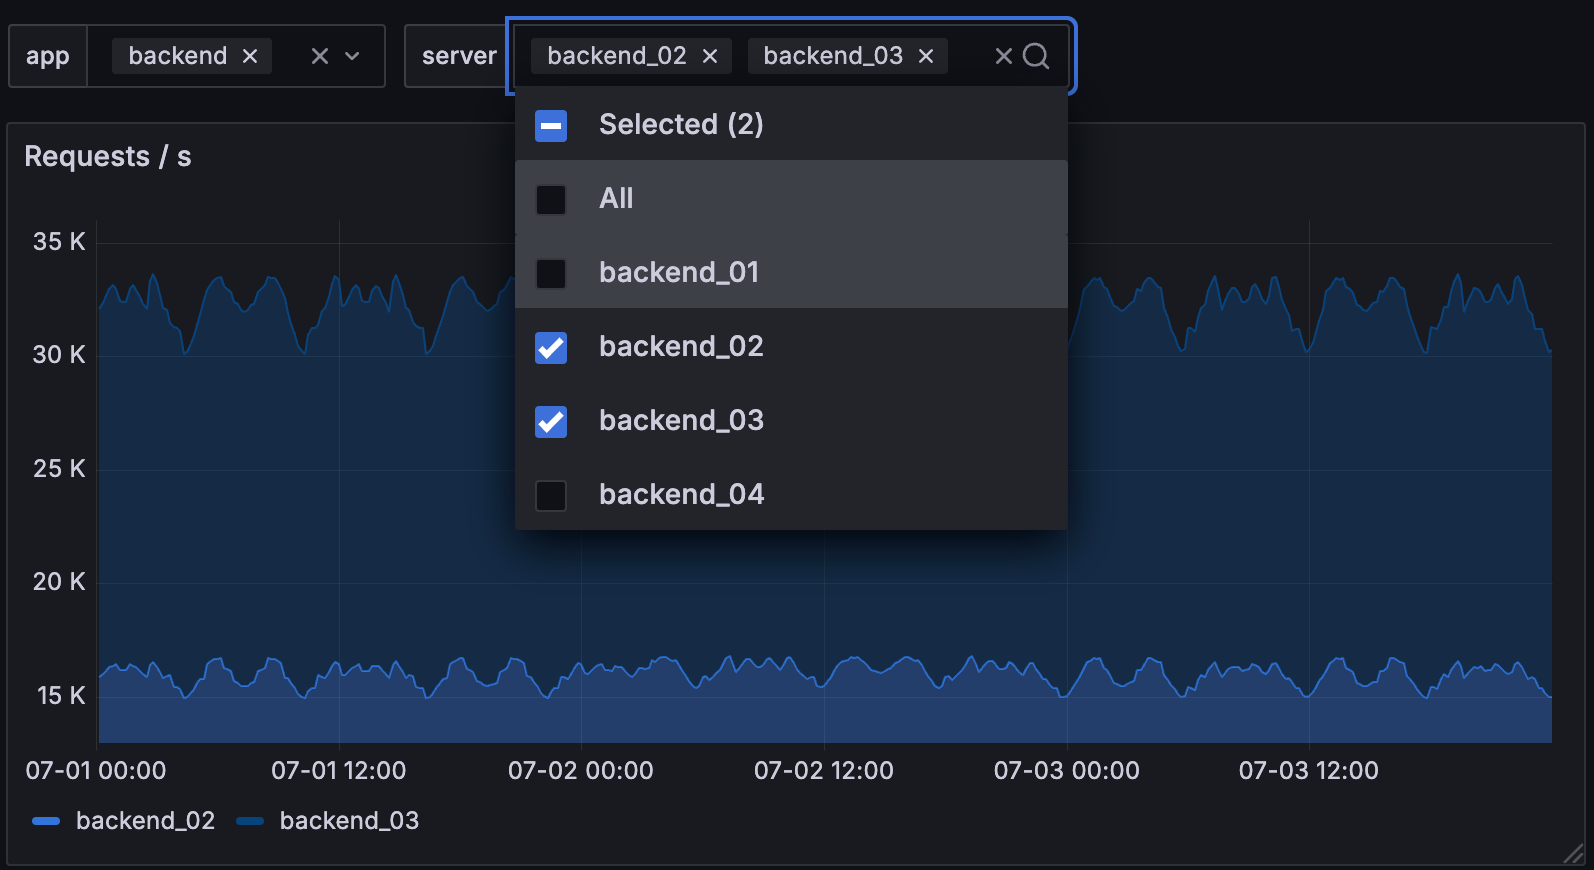
For example, if you need to monitor several servers, you could make a dashboard for each server. Or you could create one dashboard and use panels with variables like this one, where you can change the server using the variable selector:
Variables help you create interactive dashboards that adapt to different contexts. Instead of hard-coding values such as server, application, region, or sensor names, you can define a variable once and reuse it throughout the dashboard.
Using variables also allows you to single-source dashboards. If you have multiple identical data sources or servers, you can make one dashboard and use variables to change what you are viewing. This reduces dashboard duplication and maintenance.
You can use variables in:
- Data source queries
- Panel repeating options
- Dashboard and panel links
- Titles
- Descriptions
- Transformations
To work with variables, you typically do the following:
- Choose the type of variable that matches the value you want viewers to control.
- Add the variable to the dashboard.
- Use the variable in queries, titles, links, or other dashboard fields.
- Manage the variable order, dependencies, and URL behavior as the dashboard grows.
To see variable settings, click Edit in the top-right corner of the dashboard, click the Dashboard options icon, click Settings, and then click Variables.
With Grafana Play, you can explore and see how it works, learning from practical examples to accelerate your development. This feature can be seen on Templating - Interactive dashboard.
Variables you create and global variables
Grafana supports two broad kinds of variables:
- Variables you create: Dashboard-specific variables that you define and configure. Use these variables when viewers need to choose values such as a server, data source, region, environment, or interval. For configuration steps, refer to Add variables.
- Global variables: Built-in variables that Grafana provides automatically, such as the current time range, dashboard name, organization, or signed-in user. For the full reference, refer to Global variables.
Choose a variable type
Choose a variable type based on how you want Grafana to get the value and how users interact with it.
For the complete list of variable settings and type-specific steps, refer to Add variables.
Template variables
A template is any query that contains a variable.
Queries with text that starts with $ are templates.
For example, if you administer a dashboard that monitors several servers, it can have panels that use a template query like this one:
Note
Grafana documentation and the application typically refer to a template query as a query, but the terms variable and template variable are often used interchangeably.
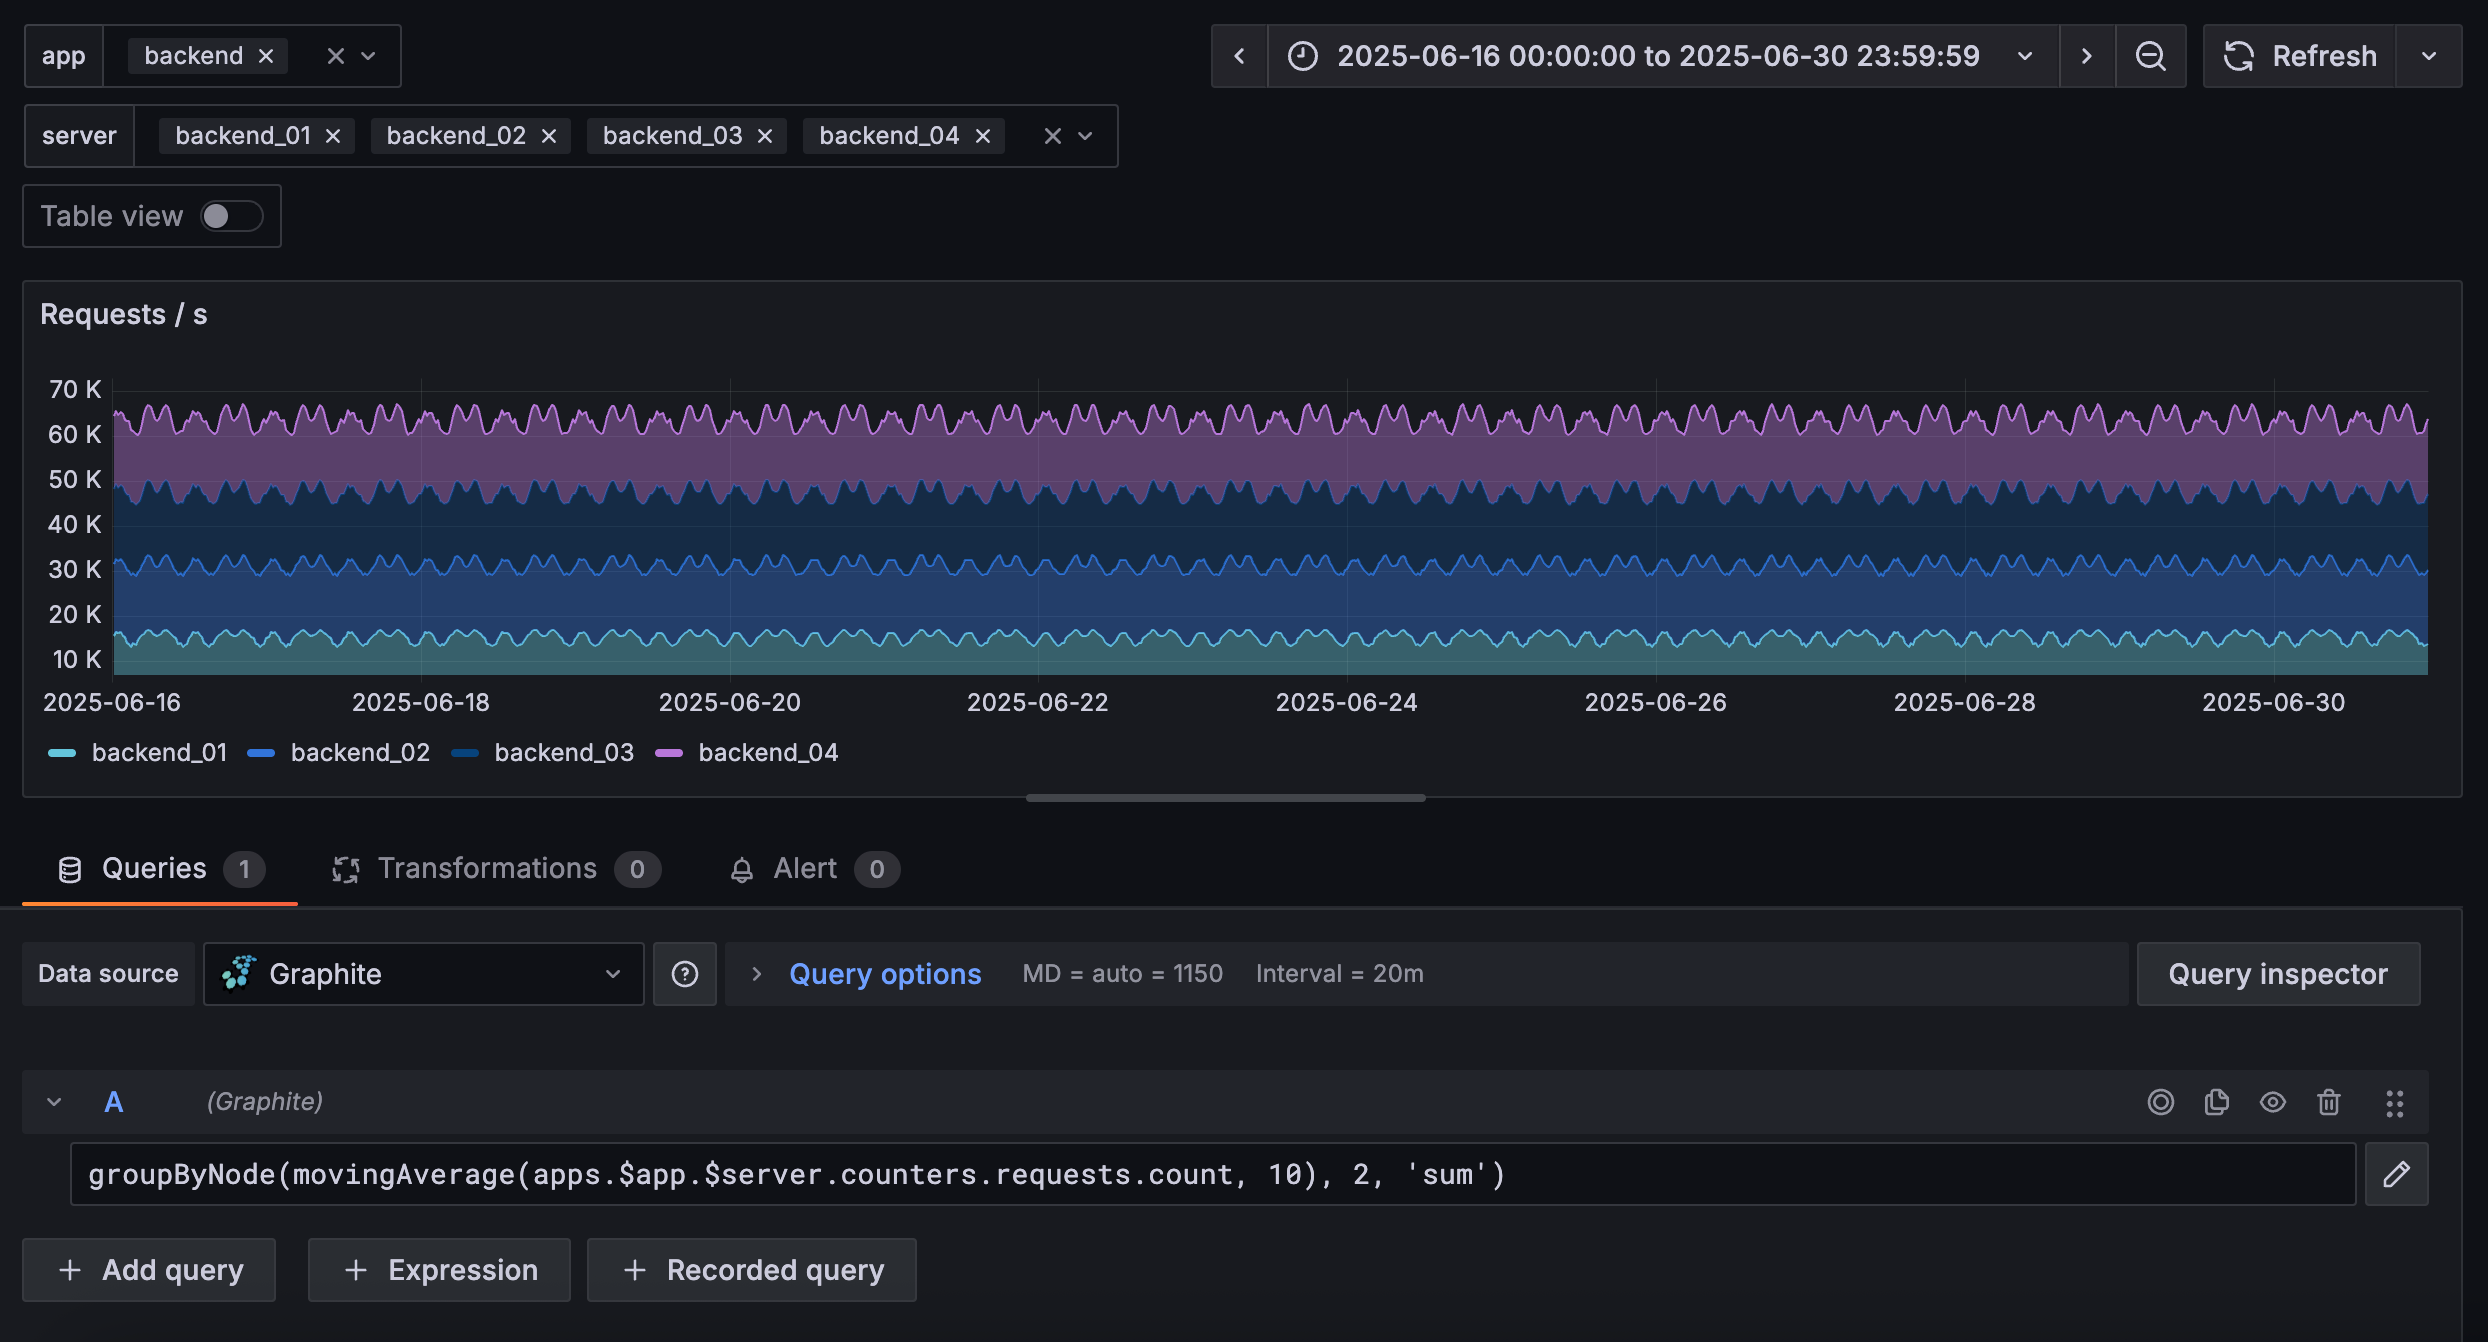
groupByNode(movingAverage(apps.$app.$server.counters.requests.count, 10), 2, 'sum')The following image shows a panel in edit mode using the query:
Note
Grafana documentation and the application typically refer to a template query as a query, but the terms variable and template variable are often used interchangeably.
Variables in URLs
By default, variable values are synced to the URL using
query parameter syntax, var-<varname>=value.
For example:
https://play.grafana.org/d/HYaGDGIMk/templating-global-variables-and-interpolation?orgId=1&from=now-6h&to=now&timezone=utc&var-Server=CCC&var-MyCustomDashboardVariable=Hello%20World%21In the preceding example, the variables and values are var-Server=CCC and var-MyCustomDashboardVariable=Hello%20World%21.
You can prevent a variable from being synced to the URL by setting skipUrlSync to true in the variable definition within the dashboard JSON model. When set, the variable value won’t appear as a var- query parameter in the URL.
This is useful when you want to keep URLs clean, prevent users from overriding a variable value through the URL, or avoid exposing sensitive values in shared links.
Note
Constant variables have
skipUrlSyncset totrueby default, since their value is fixed and not intended to be changed through the URL.
For more information about URL variables, shared links, time ranges, and filters, refer to Create dashboard URL variables.
Additional examples
The following dashboards in Grafana Play provide examples of template variables:
- Templating - Repeated panels - Using query variables to control how many panels appear in a dashboard.
- Templating - Nested Variables Drilldown - Demonstrates how changing one variable value can change the values available in a nested variable.
- Templating - Global variables and interpolation - Shows you how the syntax for Grafana variables works.
Next steps
Use the following topics based on what you want to do next:
- To create dashboard-specific variables, refer to Add variables.
- To use built-in variables for time ranges, users, organizations, or query intervals, refer to Global variables.
- To configure chained variables, multi-property variables, or regular expression filtering, refer to Advanced variable usage.
- To control how Grafana interpolates variable values, refer to Variable syntax.
- To reorder, clone, delete, or inspect variable dependencies, refer to Manage and inspect variables.
The following pages contain the full variables documentation:


